UNITED STATES
SECURITIES AND EXCHANGE COMMISSION
Washington, D.C. 20549
Form 10-K
(Mark One)
x |
ANNUAL REPORT PURSUANT TO SECTION 13 OR 15(d) OF THE SECURITIES EXCHANGE ACT OF 1934
FOR THE FISCAL YEAR ENDED December 31, 2013
OR
¨ | TRANSITION REPORT PURSUANT TO SECTION 13 OR 15(d) OF THE SECURITIES EXCHANGE ACT OF 1934 |
FOR THE TRANSITION PERIOD FROM TO
Commission file number: 001-35733
Silvercrest Asset Management Group Inc.
(Exact name of registrant as specified in its charter)
Delaware |
|
45-5146560 |
(State or other jurisdiction of incorporation) |
|
(I.R.S. Employer Identification No.) |
1330 Avenue of the Americas, 38th Floor
New York, New York 10019
(Address of principal executive offices and zip code)
(212) 649-0600
(Registrant’s telephone number, including area code)
Not Applicable
(Formed name, former address and former fiscal year, if changed since last report)
Class A common stock, $0.01 par value per share
(Title of each class)
The Nasdaq Global Market
(Name of each exchange in which registered)
Securities registered pursuant to Section 12(g) of the Act: None
Indicate by check mark if the registrant is a well-known seasoned issuer, as defined in Rule 405 of the Securities Act. Yes ¨ No x
Indicate by check mark if the registrant is not required to file reports pursuant to Section 13 or 15(d) of the Act. Yes ¨ No x
Indicate by check mark whether the registrant: (1) has filed all reports required to be filed by Section 13 or 15(d) of the Securities Exchange Act of 1934 during the preceding 12 months (or for such shorter period that the registrant was required to file such reports), and (2) has been subject to such filing requirements for the past 90 days. Yes x No ¨
Indicate by check mark whether the registrant has submitted electronically and posted on its corporate Web site, if any, every Interactive Data File required to be submitted and posted pursuant to Rule 405 of Regulation S-T (§ 232.405 of this chapter) during the preceding 12 months (or for such shorter period that the registrant was required to submit and post such files). Yes x No ¨
Indicate by check mark if disclosure of delinquent filers pursuant to Item 405 of Regulation S-K (§ 229.405 of this chapter) is not contained herein, and will not be contained, to the best of registrant’s knowledge, in definitive proxy or information statements incorporated by reference in Part III of this Form 10-K or any amendment to this Form 10-K. x
Indicate by check mark whether the registrant is a large accelerated filer, an accelerated filer, a non-accelerated filer, or a smaller reporting company. See the definitions of “large accelerated filer,” “accelerated filer” and “smaller reporting company” in Rule 12b-2 of the Exchange Act. (Check one):
Large accelerated filer |
|
¨ |
|
Accelerated filer |
|
¨ |
|
|
|
|
|||
Non-accelerated filer |
|
x (Do not check if a smaller reporting company) |
|
Smaller reporting company |
|
¨ |
Indicate by check mark whether the registrant is a shell company (as defined in Rule 12b-2 of the Exchange Act). Yes ¨ No x
The aggregate market value of the registrant’s common equity held by non-affiliates of the registrant (assuming for purposes of this computation only that the directors and executive officers may be affiliates) at June 30, 2013, which was the last business day of the registrant’s most recently completed second fiscal quarter was approximately $57.1 million based on the closing price of $12.00 for one share of common stock, as reported on The Nasdaq Global Market on June 28, 2013.
The number of outstanding shares of the registrant’s Class A common stock, par value $0.01 per share, and Class B common stock, par value $0.01 per share, as of March 18, 2014 were 7,522,974 and 4,710,045, respectively.
|
|
|
|
|
Item 1. |
|
|
1 |
|
Item 1A. |
|
|
15 |
|
Item 2. |
|
|
33 |
|
Item 3. |
|
|
33 |
|
|
|
|
|
|
Item 5. |
|
|
34 |
|
Item 6. |
|
|
36 |
|
Item 7. |
|
Management’s Discussion and Analysis of Financial Condition and Results of Operations |
|
37 |
Item 7A. |
|
|
55 |
|
Item 8. |
|
|
55 |
|
Item 9A. |
|
|
56 |
|
|
|
|
|
|
Item 10. |
|
|
57 |
|
Item 11. |
|
|
57 |
|
Item 12. |
|
Security Ownership of Certain Beneficial Owners and Management and Related Stockholder Matters |
|
57 |
Item 13. |
|
Certain Relationships and Related Transactions, and Director Independence |
|
57 |
Item 14. |
|
|
57 |
|
|
|
|
|
|
Item 15. |
|
|
58 |
Except where the context requires otherwise and as otherwise set forth herein, in this report, references to the “Company”, “we”, “us” or “our” refer to Silvercrest Asset Management Group Inc. (“Silvercrest”) and its consolidated subsidiaries, including Silvercrest L.P. (“Silvercrest L.P.” or “SLP”). SLP’s existing limited partners are referred to in this report as “principals”. On June 26, 2013, Silvercrest completed its corporate reorganization, and on July 2, 2013, Silvercrest closed its initial public offering. Prior to that date, Silvercrest was a private company. The reorganization and initial public offering are described in the notes to our Consolidated Financial Statements included in Part IV of this Form 10-K.
Forward-Looking Statements
This report contains, and from time to time our management may make, forward-looking statements within the meaning of the safe harbor provisions of the U.S. Private Securities Litigation Reform Act of 1995. In some cases, you can identify these statements by forward-looking words such as “may”, “might”, “will”, “should”, “expects”, “intends”, “plans”, “anticipates”, “believes”, “estimates”, “predicts”, “potential” or “continue”, the negative of these terms and other comparable terminology. These forward-looking statements, which are subject to risks, uncertainties and assumptions, may include projections of our future financial performance, future expenses, anticipated growth strategies, descriptions of new business initiatives and anticipated trends in our business or financial results. These statements are only predictions based on our current expectations and projections about future events. Among the important factors that could cause actual results, level of activity, performance or achievements to differ materially from those indicated by such forward-looking statements are: fluctuations in quarterly and annual results, adverse economic or market conditions, incurrence of net losses, adverse effects of management focusing on implementation of a growth strategy, failure to develop and maintain the Silvercrest brand and other factors disclosed under “Risk Factors” in this annual report on Form 10-K. We undertake no obligation to publicly update or review any forward-looking statement, whether as a result of new information, future developments or otherwise, except as required by law.
Factors that may cause our actual results to differ materially from our forward-looking statements include, but are not limited to:
· | our anticipated future results of operations; |
· | our potential operating performance and efficiency and any related reputational harm or negative perceptions in the market; |
· | our expectations with respect to future levels of assets under management, inflows and outflows; |
· | our financing plans, issuance of debt or senior equity securities, cash needs and liquidity position; |
· | our intention to pay dividends and our expectations about the amount of those dividends; |
· | our expected levels of compensation of our employees and our expected ability to hire and retain qualified investment professionals; |
· | our expectations with respect to future expenses and the level of future expenses; |
· | our expected tax rate, and our expectations with respect to deferred tax assets; |
· | our estimates of future amounts payable pursuant to our tax receivable agreements and the contingent value rights we have issued; |
· | our ability to retain clients from whom we derive a substantial portion of our assets under management; |
· | our ability to maintain our fee structure; |
· | our particular choices with regard to investment strategies employed; |
· | our ability to handle market volatility and risk in any and all markets to which we have exposure; |
· | the cost of complying with current and future regulation, coupled with the cost of defending ourselves from related investigations or litigation; |
· | failure of our operational safeguards against breaches in data security, privacy, conflicts of interest or employee misconduct; |
· | our ability to compete in an intensely competitive industry; and |
· | our reliance on prime brokers, custodians, administrators and other agents. |
Our Guiding Principles
· | We will create, build and maintain an environment that encourages innovation and original thought and apply this fresh thinking to the needs of our clients and firm. |
· | We will attract, motivate and retain unusually talented and ambitious professionals who share a passion for the investment business and an antipathy for corporate bureaucracy and office politics. |
· | We will conduct ourselves in all our dealings as highly ethical, responsible and competent professionals who always place our clients’ financial interests ahead of our own. |
· | We will encourage and nurture an entrepreneurial, collegial and action-oriented business culture in which “fun” is inevitable and decisions are generally consensual. |
Our Company
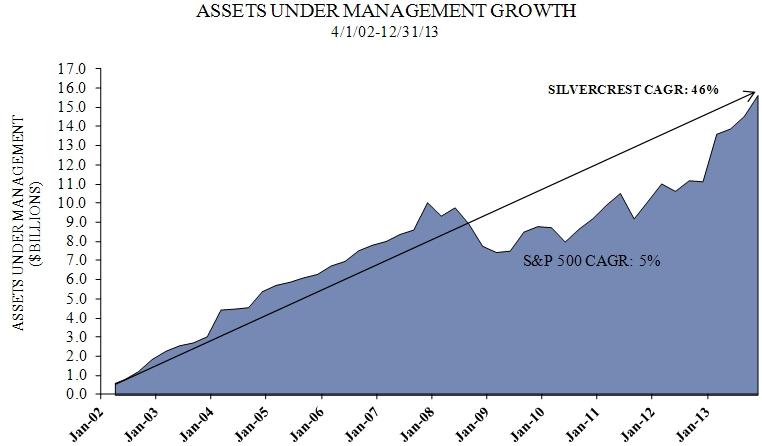
We are a full-service wealth management firm focused on providing financial advisory and related family office services to ultra-high net worth individuals and institutional investors. In addition to a wide range of investment capabilities, we offer a full suite of complementary and customized family office services for families seeking comprehensive oversight of their financial affairs. As of December 31, 2013, our assets under management were $15.7 billion.
We were founded 11 years ago on the premise that if we staffed and organized our business to deliver a combination of excellent investment performance together with high-touch client service, we would differentiate our business from a crowded field of firms nominally in the wealth management business. We seek to attract and serve a base of individuals and families with $10 million or more of investable assets, and we believe we are well-positioned to offer comprehensive investment and family office service solutions to families with over $25 million of investable assets. As of December 31, 2013, our top 483 client relationships had an average size of $32 million and represented approximately 97% of our assets under management. Our top 50 relationships averaged $218 million in size as of December 31, 2013. As a boutique, we are large enough to provide an array of comprehensive capabilities, yet agile enough to coordinate and deliver highly personalized client service.
Our annual client retention rate has averaged 98% since 2006 and, as shown below, the compound annual growth rate, or CAGR, in our assets under management since inception is 46%. Our growth rate in any 12-month period ending on the last day of a fiscal quarter since inception ranged from (23)% to 1,142%, with a mean of 54%. We believe our record of growth is a direct result of our demonstrated record of delivering excellent performance together with highly personalized service to our clients.
1
Our organic growth has been complemented by selective hiring and by five successfully completed strategic acquisitions which have expanded not only assets under management, but also our professional ranks, geographic footprint and service capabilities. We believe additional acquisitions will allow us to extend our geographic presence nationally. As we grow, we will maintain our value proposition to continue to deliver to our clients excellent investment performance together with excellent client service, the essence of what differentiates us from our competitors.
Our clients engage us to advise them on traditional investment strategies focused on equities, fixed income and cash as well as non-traditional investment strategies including hedge funds, private equity funds, real estate and commodities. Our clients receive a full menu of proprietary investment capabilities together with a focused array of complementary non-proprietary capabilities offered by unaffiliated firms selected by us. In addition to our investment capabilities, we also provide our clients with family office services and related administrative services, which include financial planning, tax planning and preparation, partnership accounting and fund administration, and consolidated wealth reporting. Our fees for our investment advisory services, non-proprietary services, and family office and related administrative services are structured to align our financial incentives with those of our clients to ensure they receive unconflicted advice. The vast majority of our fees are derived from discretionary assets under management, and are based on the value of the assets we manage for our clients. These fees increase if our clients’ assets grow in value; on the other hand, these fees decrease if our clients’ assets decline in value. We predominantly charge a management fee based on assets under management for our investment advisory services. Unlike our management fees, our fees for family office services and related administrative services are generally not based on or correlated to market values. For these services, we generally charge our clients a negotiated fee based on the scope of work. These services create strong client relationships and contribute meaningfully to our record of client retention.
As of December 31, 2013, approximately 86% of our discretionary assets under management were held for individual clients and 14% for institutional clients. Based on the results we have achieved in a number of our equity strategies, we are attracting a significant amount of institutional investor interest. Our equity capabilities are now on the approved lists of several prominent institutional consultants and, as a result, we believe significant institutional growth is likely in future years. The following chart summarizes the performance1, 2 of each of our principal equity strategies relative to their appropriate benchmarks since inception.
2
PROPRIETARY EQUITY PERFORMANCE |
|
ANNUALIZED PERFORMANCE |
|
||||||||||||||||||||
AS OF 12/31/13 |
|
INCEPTION |
|
|
|
1-YEAR |
|
|
|
3-YEAR |
|
|
|
5-YEAR |
|
|
|
7-YEAR |
|
|
|
INCEPTION |
|
|
|
|
|
|
|
|
|
|
|
|
|
|
|
|
|
|
|
|
|
|
|
|
|
Large Cap Value Composite |
|
4/1/02 |
|
|
|
34.2 |
|
|
|
15.0 |
|
|
|
17.9 |
|
|
|
7.0 |
|
|
|
8.2 |
|
Russell 1000 Value Index |
|
|
|
|
|
32.5 |
|
|
|
16.1 |
|
|
|
16.7 |
|
|
|
4.5 |
|
|
|
6.9 |
|
|
|
|
|
|
|
|
|
|
|
|
|
|
|
|
|
|
|
|
|
|
|
|
|
Small Cap Value Composite |
|
4/1/02 |
|
|
|
38.7 |
|
|
|
17.8 |
|
|
|
20.7 |
|
|
|
12.6 |
|
|
|
12.0 |
|
Russell 2000 Value Index |
|
|
|
|
|
34.5 |
|
|
|
14.5 |
|
|
|
17.6 |
|
|
|
5.4 |
|
|
|
8.8 |
|
|
|
|
|
|
|
|
|
|
|
|
|
|
|
|
|
|
|
|
|
|
|
|
|
Smid Cap Value Composite |
|
10/1/05 |
|
|
|
33.5 |
|
|
|
16.4 |
|
|
|
20.0 |
|
|
|
9.4 |
|
|
|
10.2 |
|
Russell 2500 Value Index |
|
|
|
|
|
33.3 |
|
|
|
15.4 |
|
|
|
19.6 |
|
|
|
6.4 |
|
|
|
7.9 |
|
|
|
|
|
|
|
|
|
|
|
|
|
|
|
|
|
|
|
|
|
|
|
|
|
Multi Cap Value Composite |
|
7/1/02 |
|
|
|
34.3 |
|
|
|
16.2 |
|
|
|
19.6 |
|
|
|
9.0 |
|
|
|
9.5 |
|
Russell 3000 Value Index |
|
|
|
|
|
32.7 |
|
|
|
15.9 |
|
|
|
16.8 |
|
|
|
4.6 |
|
|
|
8.0 |
|
|
|
|
|
|
|
|
|
|
|
|
|
|
|
|
|
|
|
|
|
|
|
|
|
Equity Income Composite |
|
12/1/03 |
|
|
|
34.2 |
|
|
|
17.2 |
|
|
|
18.0 |
|
|
|
9.6 |
|
|
|
12.2 |
|
Russell 3000 Value Index |
|
|
|
|
|
32.7 |
|
|
|
15.9 |
|
|
|
16.8 |
|
|
|
4.6 |
|
|
|
8.2 |
|
|
|
|
|
|
|
|
|
|
|
|
|
|
|
|
|
|
|
|
|
|
|
|
|
Focused Value Composite |
|
9/1/04 |
|
|
|
37.1 |
|
|
|
14.6 |
|
|
|
20.8 |
|
|
|
8.1 |
|
|
|
11.1 |
|
Russell 3000 Value Index |
|
|
|
|
|
32.7 |
|
|
|
15.9 |
|
|
|
16.8 |
|
|
|
4.6 |
|
|
|
7.8 |
|
1 |
Returns are based upon a time weighted rate of return of various fully discretionary equity portfolios with similar investment objectives, strategies and policies and other relevant criteria managed by Silvercrest Asset Management Group LLC (“SAMG LLC”), a subsidiary of Silvercrest. Performance results are gross of fees and net of commission charges. An investor’s actual return will be reduced by the advisory fees and any other expenses it may incur in the management of the investment advisory account. SAMG LLC’s standard advisory fees are described in Part 2 of its Form ADV. Actual fees and expenses will vary depending on a variety of factors, including the size of a particular account. Returns greater than one year are shown as annualized compounded returns and include gains and accrued income and reinvestment of distributions. Past performance is no guarantee of future results. This piece contains no recommendations to buy or sell securities or a solicitation of an offer to buy or sell securities or investment services or adopt any investment position. This piece is not intended to constitute investment advice and is based upon conditions in place during the period noted. Market and economic views are subject to change without notice and may be untimely when presented here. Readers are advised not to infer or assume that any securities, sectors or markets described were or will be profitable. SAMG LLC is an independent investment advisory and financial services firm created to meet the investment and administrative needs of individuals with substantial assets and select institutional investors. SAMG LLC claims compliance with the Global Investment Performance Standards (GIPS®).
|
2 |
The market indices used to compare to the performance of our strategies are as follows: |
|
The Russell 1000 Index is a capitalization-weighted, unmanaged index that measures the 1000 smallest companies in the Russell 3000. The Russell 1000 Value Index is a capitalization-weighted, unmanaged index that includes those Russell 1000 Index companies with lower price-to-book ratios and lower expected growth values.
|
|
The Russell 2000 Index is a capitalization-weighted, unmanaged index that measures the 2000 smallest companies in the Russell 3000. The Russell 2000 Value Index is a capitalization-weighted, unmanaged index that includes those Russell 2000 Index companies with lower price-to-book ratios and lower expected growth values.
|
|
The Russell 2500 Index is a capitalization-weighted, unmanaged index that measures the 2500 smallest companies in the Russell 3000. The Russell 2500 Value Index is a capitalization-weighted, unmanaged index that includes those Russell 2000 Index companies with lower price-to-book ratios and lower expected growth values.
|
|
The Russell 3000 Value Index is a capitalization-weighted, unmanaged index that measures those Russell 3000 Index companies with lower price-to-book ratios and lower forecasted growth. |
History, Organization and Philosophy
When forming our company, our founders had the objective of creating a large full-service boutique operation focused on managing portfolios and delivering financial advice to wealthy individuals and select institutions. We commenced operations in April of 2002. Our first partners and employees came almost entirely from Donaldson, Lufkin & Jenrette (“DLJ”) Asset Management Group which had been acquired by Credit Suisse Asset Management in late 2000. In 2002, we carefully recruited and hired the same equity, fixed income and client service teams with whom our clients had worked at DLJ Asset Management Group. As of December 31, 2013, approximately a quarter of our 93 employees are veterans of DLJ. Many of our principals, therefore, have worked together for 20 years and, in some cases, even longer.
Our headquarters are located in New York City with additional offices in Boston, Massachusetts, Los Angeles, California and Charlottesville, Virginia. From inception we have embraced an organizational structure in which the primary functions of client service, investments, technology and operations and business administration were organized and staffed with professionals who specialize in each of those functions. This structure permits each professional to focus on his or her area of expertise without the distraction of other business responsibilities. At many other firms the senior professionals are expected to serve multiple roles simultaneously, which we believe dilutes the value to clients and makes scaling the business effectively unachievable. We firmly
3
believe that our business structure represents a better approach and will permit us to greatly expand our business on our existing platform.
In meeting our primary objective to deliver strong investment results, we seek to add value through our asset allocation advice, as well as through our proprietary equity and fixed income strategies and outsourced investment capabilities. We recruited and hired a team of seasoned securities analysts who have an institutional caliber approach to security selection and a long record of success in implementing their strategies. We encourage them to focus 100% of their professional time on the task of securities selection. Our in-house equity analysts are focused on U.S. large cap, small cap, smid cap, multi cap, equity income and focused value equity strategies. On the fixed income side, our analysts are focused on high-grade municipals, high-yield municipals and high-grade taxables.
In order to deliver excellent client service, our portfolio managers are charged with the responsibility of working individually with each client to help define investment objectives, risk tolerance, cash flow requirements and other financial needs. Client-facing portfolio managers, their support staffs and the family office services group account for 48% of our total employees, a reflection of our high commitment to excellent client service. We are staffed to assure that each client receives senior level personal attention.
We have a staff of 9 professionals who work with our portfolio managers to deliver family office services to interested clients. The fees for family office services are negotiated with the client and generally are not asset-based. For this reason, the revenues generated by our family office services are non-correlated to market movements and provide us with a diversified source of earnings. We believe these family office services have been an attractive component of our overall value proposition and engender a stronger relationship with the client, leading to greater client retention and the institutionalization of client relationships.
Our Growth Strategy
We built our company to take market share from financial services firms whose wealth management models we believe are flawed. Our growth strategy has been and will continue to be to grow our business organically, to complement our organic growth with strategic hires and acquisitions and to expand our presence in the institutional market. In support of each of these initiatives we plan to continue to invest in establishing our brand through continued selective advertising and public relations.
Organic Growth
We have a proven ability to identify, attract and retain ultra-high net worth clients who seek a firm designed to deliver excellent investment performance and excellent client service. Our organizational model of separate and distinct business functions has proven scalable and our company’s assets under management have grown to $15.7 billion as of December 31, 2013 without a commensurate increase in headcount. Importantly, we have achieved our growth while maintaining our profitability during one of the most challenging periods in the history of the U.S. financial markets. Going forward, we will continue to execute our business plan for attracting ultra-high net worth clients.
The business of attracting ultra-high net worth clients is the business of obtaining referrals and gaining trust. At our company these responsibilities reside principally with our portfolio managers. Our senior portfolio managers have on average nearly 30 years of industry experience and they have developed a wealth of contacts and professional referral sources as a result of that experience. In spearheading the effort to deliver excellent performance and service to their clients, our portfolio managers have developed very close relationships with their clients and in many cases these relationships are much older than our company itself. Much of our new business results from referrals from existing clients. In this regard, it is critical that our portfolio managers work closely with each of their clients to establish the trust that is at the heart of the relationship.
Where appropriate, our portfolio managers are also encouraged to introduce our clients to our family office services capabilities and we expect to see growth in client utilization of these services in the future. Nine of our ten largest clients use our family office services and some of these clients have closed their own family offices to consolidate those activities with us. This is a profitable business for us and it serves to tighten our ties to those clients who avail themselves of the services we offer. It is also extremely useful to us in new business competitions where we use these services as a differentiator from our competitors. We expect much greater penetration with our current clients in future years and we expect that many of our new clients will use these services extensively.
Complementing the efforts of our senior portfolio managers to cultivate client referrals, our business development team is charged with identifying newly formed wealth (resulting from merger, acquisition or corporate finance) and then creating customized solicitations. Our objective is two-fold: we will expand awareness of our company and its capabilities by distributing our marketing materials to this new audience and we will attract a certain amount of new business. The basis of this effort is careful research designed to ascertain if the prospect has any relationship with us-or any of our clients or friends-and then our solicitation is tailored to those circumstances.
In all of our business development efforts we devote a great deal of time and effort to developing highly customized and detailed proposals for our prospects. In order to do so, we spend as much time as is required to thoroughly understand the prospect’s
4
circumstances and goals as well as the sources of its dissatisfaction with its existing adviser. Where appropriate our proposals include the integration of our entire suite of family office services. We believe our customized new business presentations distinguish us from both our much larger competitors, which have substantial resources, but whose size, we believe, may impede them from easily tailoring solutions to suit clients’ needs, as well as from our smaller competitors whom, we believe, do not have our depth of resources or capabilities.
Acquired Growth
From our inception, our organic growth has been complemented by selective hiring and strategic acquisitions which have served to enlarge our client base, expand our professional ranks, increase our geographic presence and broaden our service capabilities. We therefore expect to continue to recruit and hire senior portfolio managers with significant client relationships as well as successful investment professionals with capabilities currently not available internally to us. We have used acquisitions to extend our presence into new geographies (Boston, Charlottesville) and to gain new investment expertise. The five strategic acquisitions we have successfully completed have allowed us to benefit from economies of scale and scope.
In making acquisitions, we look for firms with compatible professionals of the highest integrity who believe in our high service-high performance model for the business. It is important that their clientele be principally clients of high net worth and it is helpful if they have a similar value-based investment methodology. These firms are attracted to our company by the strength of our brand, the breadth of our services and the integrity of our people. Often these firms are extremely limited in the investment products and services they can offer their clients and it is not uncommon that they have succession or other management issues to resolve. In addition, the high and growing cost of compliance with federal and state laws governing their business is often an added inducement. We believe we will become the partner of choice for many such firms.
Continuing our short-term growth strategy, we intend to establish offices in major wealth centers on the West Coast, in the Southwest and in the Midwest in order to be closer to both our clients and to prospective clients.
Our past acquisitions have sharpened our ability to integrate acquired businesses, and we believe that once we identify an acquisition target we will be able to complete the acquisition and the integration of the acquired business expeditiously.
Institutional Growth
After five years of effort focused on cultivating relationships with institutional investment consultants, we continue to regularly make new business presentations to institutional investors, including public and corporate pension funds, endowments, foundations, and their consultants.
We are on the “approved” lists of certain prominent institutional investment consultants, which means that these consultants would be prepared to recommend our firm to clients in search of a particular investment strategy for its clients. This has significantly enhanced our ability to win mandates these consultants seek for their institutional clients and as a result we have won institutional mandates in our equity strategies. We expect this trend to continue once it is publicly known that these and other institutions have engaged us to manage significant portfolios for them. The importance of institutional growth to our company is noteworthy: institutional assets will likely expand not only our assets under management but also our profit margins; and the painstaking due diligence conducted by these institutions before selecting us will ratify and confirm the decisions to hire us made by our individual clients.
Brand Management
We have invested heavily to build, maintain and extend our brand. We have done so in the belief that creating awareness of our company and its differentiated characteristics would support all aspects of our business but most notably our growth.
With limited resources, we have created a focused national advertising campaign, which has drawn praise from clients, prospects and competitors alike. We have carefully chosen media outlets that reach our target audience efficiently and we estimate that the new business, which we get directly as a result of our advertising, now finances its cost.
Complementing our advertising strategy and again with limited resources, we have also invested in an effort to get media coverage of our company in some of the nation’s most prestigious national publications as well as in industry journals and newsletters. This effort has resulted in press coverage by the Wall Street Journal, Barron’s, Bloomberg, the Financial Times and The New York Times as well as various trade publications distributed within our industry. This public relations effort has proven very helpful in establishing our company as a leader in our industry.
5
Our Business Model
We were founded in 2002 to provide independent investment advisory and related family office services to ultra-high net worth individuals and endowments, foundations and other institutional investors. To this end, we are structured to provide our clients with institutional-quality investment management with the superior level of service expected by wealthy individuals.
To provide this high level of service, we rely on portfolio management teams and our family office services team to provide objective, conflict-free investment management selection and a fully integrated, customized family-centric approach to wealth management. We believe the combination of comprehensive family office service, excellent investment capabilities and a high level of personal service allows us to take advantage of economies of scale to service the needs of our ultra-high net worth clients.
We have dedicated investment management teams tasked with successfully implementing their respective investment strategies. To increase the probability of success in meeting this objective, our analysts are not responsible for client interaction, management of our business, marketing or compliance oversight. This enables us to effectively serve ultra-high net worth clients as well as institutions which typically perform in-depth due diligence before selecting a manager.
Delivering Investment Performance
The Investment Policy & Strategy Committee, or IPSC, which is comprised of our chief strategist and several of our senior portfolio managers, is charged with the responsibility of adding value through asset allocation and manager selection. This is done through the use of our proprietary investment management by our internal analysts, and by those whom we believe are best-of-breed external managers.
The IPSC develops model asset allocations assuming differing levels of risk, liquidity and income tolerance as well as conducting outside manager due diligence. Our proprietary model portfolio structures are not merely a backward-looking, mechanical exercise based on the past performance of different asset classes. Instead, our IPSC overlays our judgment on the likely future performance of different asset classes in arriving at optimal portfolio structures. None of our dedicated investment analysts serves on this committee, which safeguards the independence of the IPSC’s recommendations.
Our portfolio managers are responsible for creating a customized investment program for each client based upon the IPSC’s work. An interactive dialogue ensures that each portfolio plan is based upon each client’s defined written objectives. Each client’s portfolio strategy takes into account that client’s risk tolerance, income and liquidity requirements as well as the effect of diversifying out of low-basis and/or sentimental holdings.
Historically, the IPSC has added value to our clients’ portfolios through asset allocation weightings and manager selection. The chart below shows the performance results of our company’s basic asset allocation model portfolios developed by the IPSC using our proprietary and outsourced investment capabilities.
6
MODEL PORTFOLIO PERFORMANCE |
|
ANNUALIZED PERFORMANCE |
||||||||||
AS OF 12/31/13 |
|
INCEPTION |
|
1-YEAR |
|
3-YEAR |
|
5-YEAR |
|
7-YEAR |
|
INCEPTION |
Income Portfolio |
|
5-1-03 |
|
13.4 |
|
7.7 |
|
9.9 |
|
6.1 |
|
7.0 |
25/45/30% S&P 500, Barclays Aggregate, HFRI FOF Comp |
|
|
|
9.6 |
|
6.4 |
|
8.5 |
|
4.8 |
|
6.0 |
Balanced Portfolio |
|
5-1-03 |
|
18.4 |
|
8.8 |
|
12.6 |
|
6.6 |
|
8.2 |
50/30/20% S&P 500, Barclays Aggregate, HFRI FOF Comp |
|
|
|
17.0 |
|
9.7 |
|
12.0 |
|
5.7 |
|
7.3 |
Growth Portfolio |
|
5-1-03 |
|
27.6 |
|
11.7 |
|
17.9 |
|
7.3 |
|
9.7 |
80/10/10% S&P 500, Barclays Aggregate, HFRI FOF Comp |
|
|
|
26.4 |
|
13.6 |
|
15.8 |
|
6.1 |
|
8.4 |
|
These model portfolios are not actual strategies in which clients can invest or allocate assets. They are hypothetical combinations of: (i) internally-managed strategies in which clients are invested and (ii) externally-managed funds or products in which clients are invested. We track three such portfolios depending on the overall strategy by which the securities purchased may be characterized. They are Income, Growth, and Balanced (Income and Growth). The returns shown assume annual rebalancing and reinvestment of dividends over the entirety of each of the periods shown. Some of the underlying returns used to calculate each portfolio’s returns were net of fees and some were gross of fees. The rates of return for each of the three portfolios are presented gross of investment management fees and custody fees, but include the deduction of estimated brokerage commissions and transaction costs. An investor’s actual return on a portfolio of the type shown would be reduced by the advisory fees and any other expenses it may incur in the management of the investment advisory account. For example, assume the Firm achieves a 10% annual return prior to the deduction of fees each year for a period of 10 years. If an annual investment management fee of 1% of assets under management for the 10 year period were charged, the resulting annual average return after fees would be reduced to 8.9%. Silvercrest’s standard annual asset-based fee schedule is described in Part 2 of its Form ADV, and outsourced manager’s standard annual asset-based fee schedules are described in Part 2 of each of their Form ADVs. Actual fees and expenses will vary depending on a variety of factors, including the size of a particular account. Generally, investment management fees are charged based upon the size of the portfolio, computed quarterly. An investor’s actual result would be different from those portrayed in the models. A reader should not infer or assume that any portfolio is appropriate to meet the objectives, situation or needs of a particular investor, as the implementation of any financial strategy, and the purchase or sale of any security, should only be made after consultation with an attorney, tax advisor and investment advisor. Past performance is no indication of future results.
|
|
The benchmark is a composite of the S&P 500 Index, the Barclays Capital Aggregate Index, and the HFRI Fund of Funds Composite Index. Each index’s blend is rebalanced annually. Index returns do not reflect a deduction for fees or expenses. Investors cannot invest directly in any of these indices. |
|
The market indices used to compare to the performance of our strategies are as follows: |
|
The Barclays Capital Aggregate Index is an index of investment grade government and corporate bonds with a maturity of more than one year.
The S&P 500 Index is a capitalization-weighted, unmanaged index that measures 500 widely held US common stocks of leading companies in leading industries, representative of the broad US equity market.
The HFRI Fund of Funds Composite Index is an index that is equal weighted, net of fees, and comprised of over 1,500 funds which report to Hedge Fund Research. |
From inception, we have employed a system of peer group reviews to ensure that client portfolios have been constructed in a manner consistent with our best collective thinking. In annual peer group reviews, the asset allocation within client portfolios is compared with the portfolios’ defined objectives and portfolios which are not fully aligned with the investment objective, are then singled out for further review and discussion. Our objective is for all clients to receive our best thinking and that portfolio managers are managing portfolios consistently with our policy. As a combination of these various factors, the client relationship is with us and not merely with an individual at our company.
We believe that it is impossible for a single manager to perform all forms of investing equally well. Thus, our core proprietary investment capabilities are focused on a narrow range of highly disciplined U.S. equity and fixed income management strategies. Our investment teams have exhibited strong performance records. With respect to these strategies, roughly 52% of our total assets under management are managed in our proprietary investment strategies.
Our outsourced investment capabilities include alternative investments as well as traditional investment approaches in the categories of domestic large, mid and small cap growth equity, international equities and high yield bonds.
Proprietary Equity Strategies
Our equity strategies rely on a team-based investment approach and a rigorous investment process. This approach has resulted in returns that exceed relevant market benchmarks. We believe this team approach has provided and will continue to provide consistency to our investment process and results over the long-term. Our investment analysts are generalists who employ a “bottom-up” value oriented equity selecting methodology. Our analysts collectively monitor a universe of approximately 100 stocks which are deemed to be attractively valued relative to their business outlook and management’s history of adding value.
Once stocks have been approved for investment from this body of research, they become part of one or more model equity portfolios. These are generally large cap, small cap, smid cap, multi-cap, equity income and focused value. Each stock position is
7
continually monitored against its investment thesis to ensure investment discipline, and we employ a strict discipline to trim or sell securities in the following circumstances:
· | When a stock is excessively valued in our models or the best case scenario is reflected in the stock price; |
· | Due to a stock’s outperformance, which can adversely affect a portfolio’s diversification; |
· | Due to underperformance, when a stock trails relevant benchmarks by more than 10%; |
· | When the investment thesis changes, due to a loss of confidence in management, a change in business prospects, or the deterioration in earnings quality. |
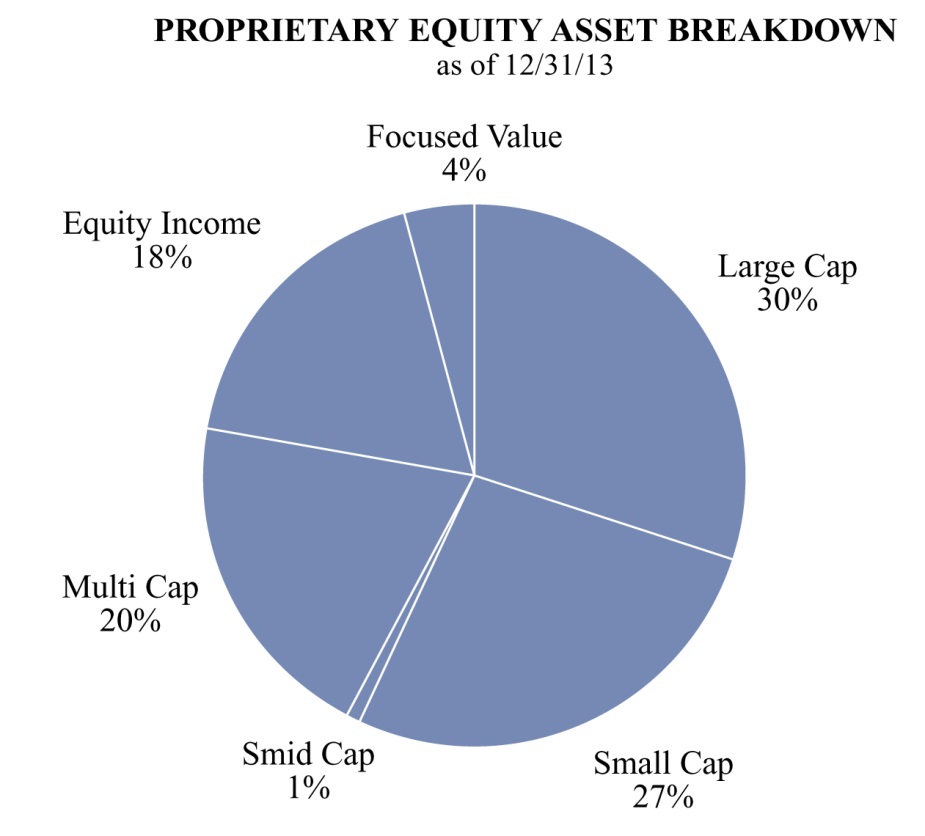
Below is a breakdown of assets among the various proprietary equity strategies as of December 31, 2013:
8
Each of our equity strategies has outperformed its benchmark since inception as illustrated by the following chart:
PROPRIETARY EQUITY PERFORMANCE |
|
ANNUALIZED PERFORMANCE |
|
||||||||||||||||||||
AS OF 12/31/13 |
|
INCEPTION |
|
|
|
1-YEAR |
|
|
|
3-YEAR |
|
|
|
5-YEAR |
|
|
|
7-YEAR |
|
|
|
INCEPTION |
|
|
|
|
|
|
|
|
|
|
|
|
|
|
|
|
|
|
|
|
|
|
|
|
|
Large Cap Value Composite |
|
4/1/02 |
|
|
|
34.2 |
|
|
|
15.0 |
|
|
|
17.9 |
|
|
|
7.0 |
|
|
|
8.2 |
|
Russell 1000 Value Index |
|
|
|
|
|
32.5 |
|
|
|
16.1 |
|
|
|
16.7 |
|
|
|
4.5 |
|
|
|
6.9 |
|
|
|
|
|
|
|
|
|
|
|
|
|
|
|
|
|
|
|
|
|
|
|
|
|
Small Cap Value Composite |
|
4/1/02 |
|
|
|
38.7 |
|
|
|
17.8 |
|
|
|
20.7 |
|
|
|
12.6 |
|
|
|
12.0 |
|
Russell 2000 Value Index |
|
|
|
|
|
34.5 |
|
|
|
14.5 |
|
|
|
17.6 |
|
|
|
5.4 |
|
|
|
8.8 |
|
|
|
|
|
|
|
|
|
|
|
|
|
|
|
|
|
|
|
|
|
|
|
|
|
Smid Cap Value Composite |
|
10/1/05 |
|
|
|
33.5 |
|
|
|
16.4 |
|
|
|
20.0 |
|
|
|
9.4 |
|
|
|
10.2 |
|
Russell 2500 Value Index |
|
|
|
|
|
33.3 |
|
|
|
15.4 |
|
|
|
19.6 |
|
|
|
6.4 |
|
|
|
7.9 |
|
|
|
|
|
|
|
|
|
|
|
|
|
|
|
|
|
|
|
|
|
|
|
|
|
Multi Cap Value Composite |
|
7/1/02 |
|
|
|
34.3 |
|
|
|
16.2 |
|
|
|
19.6 |
|
|
|
9.0 |
|
|
|
9.5 |
|
Russell 3000 Value Index |
|
|
|
|
|
32.7 |
|
|
|
15.9 |
|
|
|
16.8 |
|
|
|
4.6 |
|
|
|
8.0 |
|
|
|
|
|
|
|
|
|
|
|
|
|
|
|
|
|
|
|
|
|
|
|
|
|
Equity Income Composite |
|
12/1/03 |
|
|
|
34.2 |
|
|
|
17.2 |
|
|
|
18.0 |
|
|
|
9.6 |
|
|
|
12.2 |
|
Russell 3000 Value Index |
|
|
|
|
|
32.7 |
|
|
|
15.9 |
|
|
|
16.8 |
|
|
|
4.6 |
|
|
|
8.2 |
|
|
|
|
|
|
|
|
|
|
|
|
|
|
|
|
|
|
|
|
|
|
|
|
|
Focused Value Composite |
|
9/1/04 |
|
|
|
37.1 |
|
|
|
14.6 |
|
|
|
20.8 |
|
|
|
8.1 |
|
|
|
11.1 |
|
Russell 3000 Value Index |
|
|
|
|
|
32.7 |
|
|
|
15.9 |
|
|
|
16.8 |
|
|
|
4.6 |
|
|
|
7.8 |
|
1 |
Returns are based upon a time weighted rate of return of various fully discretionary equity portfolios with similar investment objectives, strategies and policies and other relevant criteria managed by Silvercrest Asset Management Group LLC (“SAMG LLC”), a subsidiary of Silvercrest. Performance results are gross of fees and net of commission charges. An investor’s actual return will be reduced by the advisory fees and any other expenses it may incur in the management of the investment advisory account. SAMG LLC’s standard advisory fees are described in Part 2 of its Form ADV. Actual fees and expenses will vary depending on a variety of factors, including the size of a particular account. Returns greater than one year are shown as annualized compounded returns and include gains and accrued income and reinvestment of distributions. Past performance is no guarantee of future results. This piece contains no recommendations to buy or sell securities or a solicitation of an offer to buy or sell securities or investment services or adopt any investment position. This piece is not intended to constitute investment advice and is based upon conditions in place during the period noted. Market and economic views are subject to change without notice and may be untimely when presented here. Readers are advised not to infer or assume that any securities, sectors or markets described were or will be profitable. SAMG LLC is an independent investment advisory and financial services firm created to meet the investment and administrative needs of individuals with substantial assets and select institutional investors. SAMG LLC claims compliance with the Global Investment Performance Standards (GIPS®).
|
2 |
The market indices used to compare to the performance of our strategies are as follows: |
|
The Russell 1000 Index is a capitalization-weighted, unmanaged index that measures the 1000 smallest companies in the Russell 3000. The Russell 1000 Value Index is a capitalization-weighted, unmanaged index that includes those Russell 1000 Index companies with lower price-to-book ratios and lower expected growth values.
|
|
The Russell 2000 Index is a capitalization-weighted, unmanaged index that measures the 2000 smallest companies in the Russell 3000. The Russell 2000 Value Index is a capitalization-weighted, unmanaged index that includes those Russell 2000 Index companies with lower price-to-book ratios and lower expected growth values.
|
|
The Russell 2500 Index is a capitalization-weighted, unmanaged index that measures the 2500 smallest companies in the Russell 3000. The Russell 2500 Value Index is a capitalization-weighted, unmanaged index that includes those Russell 2000 Index companies with lower price-to-book ratios and lower expected growth values.
|
|
The Russell 3000 Value Index is a capitalization-weighted, unmanaged index that measures those Russell 3000 Index companies with lower price-to-book ratios and lower forecasted growth. |
Proprietary Fixed Income Strategies
In the management of fixed income investments, clients typically give us the mandate to produce stable returns to dampen the volatility of their portfolios as a counter-weight to equities as part of their complete asset allocation. For those investors who can take advantage of the tax exemption of municipal bonds, we have developed two high-yield municipal bond products designed to add value to the returns possible from high-grade bonds in a low interest rate environment. Below is the breakdown of assets under management by strategy as of December 31, 2013:
9
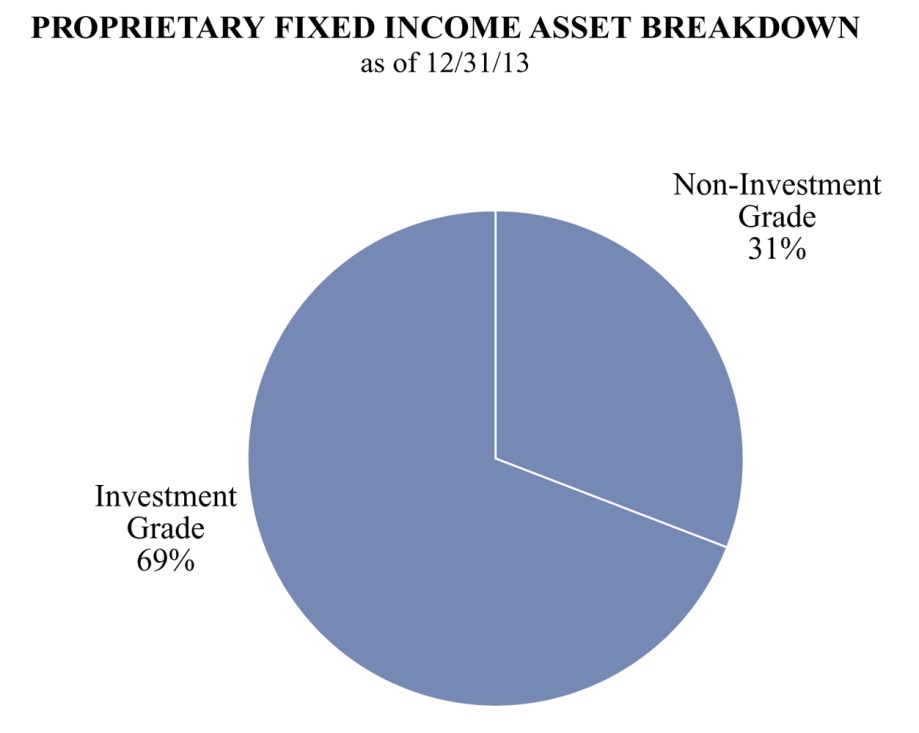
Our fixed income strategy employs a bottom-up fundamental value approach designed to minimize the risk of loss. Almost all of our bond portfolios are highly customized and focused on income and liquidity generation as opposed to capital appreciation.
Outsourced Manager Selection
Recognizing the value of diversification to our clients, we offer a variety of outsourced investment capabilities designed to complement our proprietary capabilities. These outsourced capabilities include managers who have long records of success in managing growth equities, international equities, taxable high yield bonds, hedge funds and other strategies not offered on a proprietary basis by us. In selecting these managers, we utilize an investment manager database for initial screening and then a dedicated staff conducts on-site due diligence. Potential managers are reviewed and selected by our IPSC. Our selection criteria include the following:
· | Highly Consistent Returns. We emphasize consistency of performance over strong performance marked by high volatility. |
· | Tax Sensitivity. We seek managers with a low turnover style of management designed to achieve attractive after-tax rates of return. |
· | Solid Operations, Technology. We require each manager to produce evidence that it has strong technology and operations capabilities as well as vigorous compliance adherence. |
· | Alignment of Interest. We require evidence that the strategy’s key people have significant equity in their company and are motivated to stay in place. |
· | Will Negotiate Fees. We require our traditional managers to accept a significant discount in their management fees because we expect to manage all aspects of the client relationship. Their only responsibility is to manage the capital entrusted to them. No manager has refused to offer the discounts we seek. |
For large clients with significant hedge fund exposure, we offer a hedge fund advisory service to create customized hedge fund portfolios. Each of our funds of funds capabilities appears below:
· | Silvercrest Hedged Equity Fund is designed to complement and diversify long-only equity portfolios through investments with managers who employ long and short strategies; |
· | Silvercrest Emerging Markets Fund provides international and non-dollar exposure and diversification focused on long, short, credit and other managers who invest in emerging markets; |
· | Silvercrest Commodity Strategies Fund seeks to give investors comprehensive commodity exposure; and |
· | Silvercrest Special Situations Fund is designed to outperform traditional benchmarks with less volatility. |
We have two types of fee arrangements with outsourced managers. Clients either pay a discounted fee, negotiated by us, directly to the manager who retains the entire fee or directly to the manager who distributes a portion of the fee to us. Clients are informed of this arrangement and have signed a written acknowledgement.
10
Delivering Client Service
We take a holistic approach to client service, whereby a senior portfolio manager spearheads the coordination of the IPSC recommendations, family office services work and the investment management team in order to deliver the full range of our capabilities to the client.
Nine out of our ten largest high net worth clients use one or more components of our family office services. We believe that this is an attractive growth area for our company and we have initiated plans to increase the provision of these services to both broaden relationships with existing clients and to attract potential clients. Our family office services are profitable and are not used as a loss-leader for attracting clients. Our family office capabilities include the following:
· | Financial Planning; |
· | Tax Planning and Preparation; |
· | Partnership Accounting and Fund Administration; |
· | Consolidated Wealth Reporting; |
· | Estate or Trust Agency; and |
· | Art Consultancy, Management. |
For institutional client relationships, contact with our clients is handled by a dedicated institutional client service team headed by a Managing Director who also maintains our relationships with institutional investment consultants. This structure permits our investment professionals to maintain their focus on achieving superior investment results without the distraction of client demands.
Competition
The wealth management industry is highly competitive and is comprised of many players. We compete directly with some of the largest financial service companies, as well as some of the smallest. We primarily compete on the basis of several factors, including our level of service, the quality of our advice, independence, stability, performance results, breadth of our capabilities and fees. In general, these competitors fall into one of the following categories:
· | Diversified Financial Institutions have divisions aimed at providing wealth management solutions to the high net worth segment that are usually staffed by brokers. |
· | Asset Management Firms offer proprietary institutional and retail asset management services catering to the high net worth segment largely with off-the-shelf products. |
· | Trust Companies combine fiduciary and investment services as well as ancillary financial services. |
· | MFO/RIAs focus exclusively on the high net worth segment and are frequently dominated by one or two families. |
As a registered investment adviser that is not affiliated with other financial firms, we are free from the conflicts associated with brokerage or investment banking firms. In advising our clients on portfolio strategies, we are motivated to meet our clients’ investment objectives—not to generate commissions or placement fees—and to focus solely on providing excellent service and investment performance.
We have the size and resources to compete with larger organizations, and unlike many smaller firms, to provide our clients with fully customized, full-service wealth management and integrated family office solutions.
While many competitors outsource investment management, we have chosen to compete with excellent proprietary investment capabilities coupled with a focused array of complementary non-proprietary capabilities offered by unaffiliated firms. This combination enables us to compete for and win the business of wealthy investors. We believe this is a key to our past and future success.
Employees
As of December 31, 2013, we had 92 full-time employees and one part-time employee. None of our employees are subject to a collective bargaining agreement. We believe that relations with our employees are good.
11
Our Structure and Reorganization
Holding Company Structure
Our only business is acting as the general partner of Silvercrest L.P. and, as such, we will continue to operate and control all of its business and affairs and consolidate its financial results into our financial statements. The ownership interests of holders of limited partnership interests of Silvercrest L.P. are accounted for as a non-controlling interest in our consolidated financial statements.
Net profits, net losses and distributions of Silvercrest L.P. are allocated and made to each of its partners on a pro rata basis in accordance with the number of partnership units of Silvercrest L.P. held by each of them. In addition, Silvercrest L.P. has issued deferred equity units exercisable for Class B units which entitle the holders thereof to receive distributions from Silvercrest L.P. to the same extent as if the underlying Class B units were outstanding.
12
Set forth below is our holding company structure and ownership as of December 31, 2013.
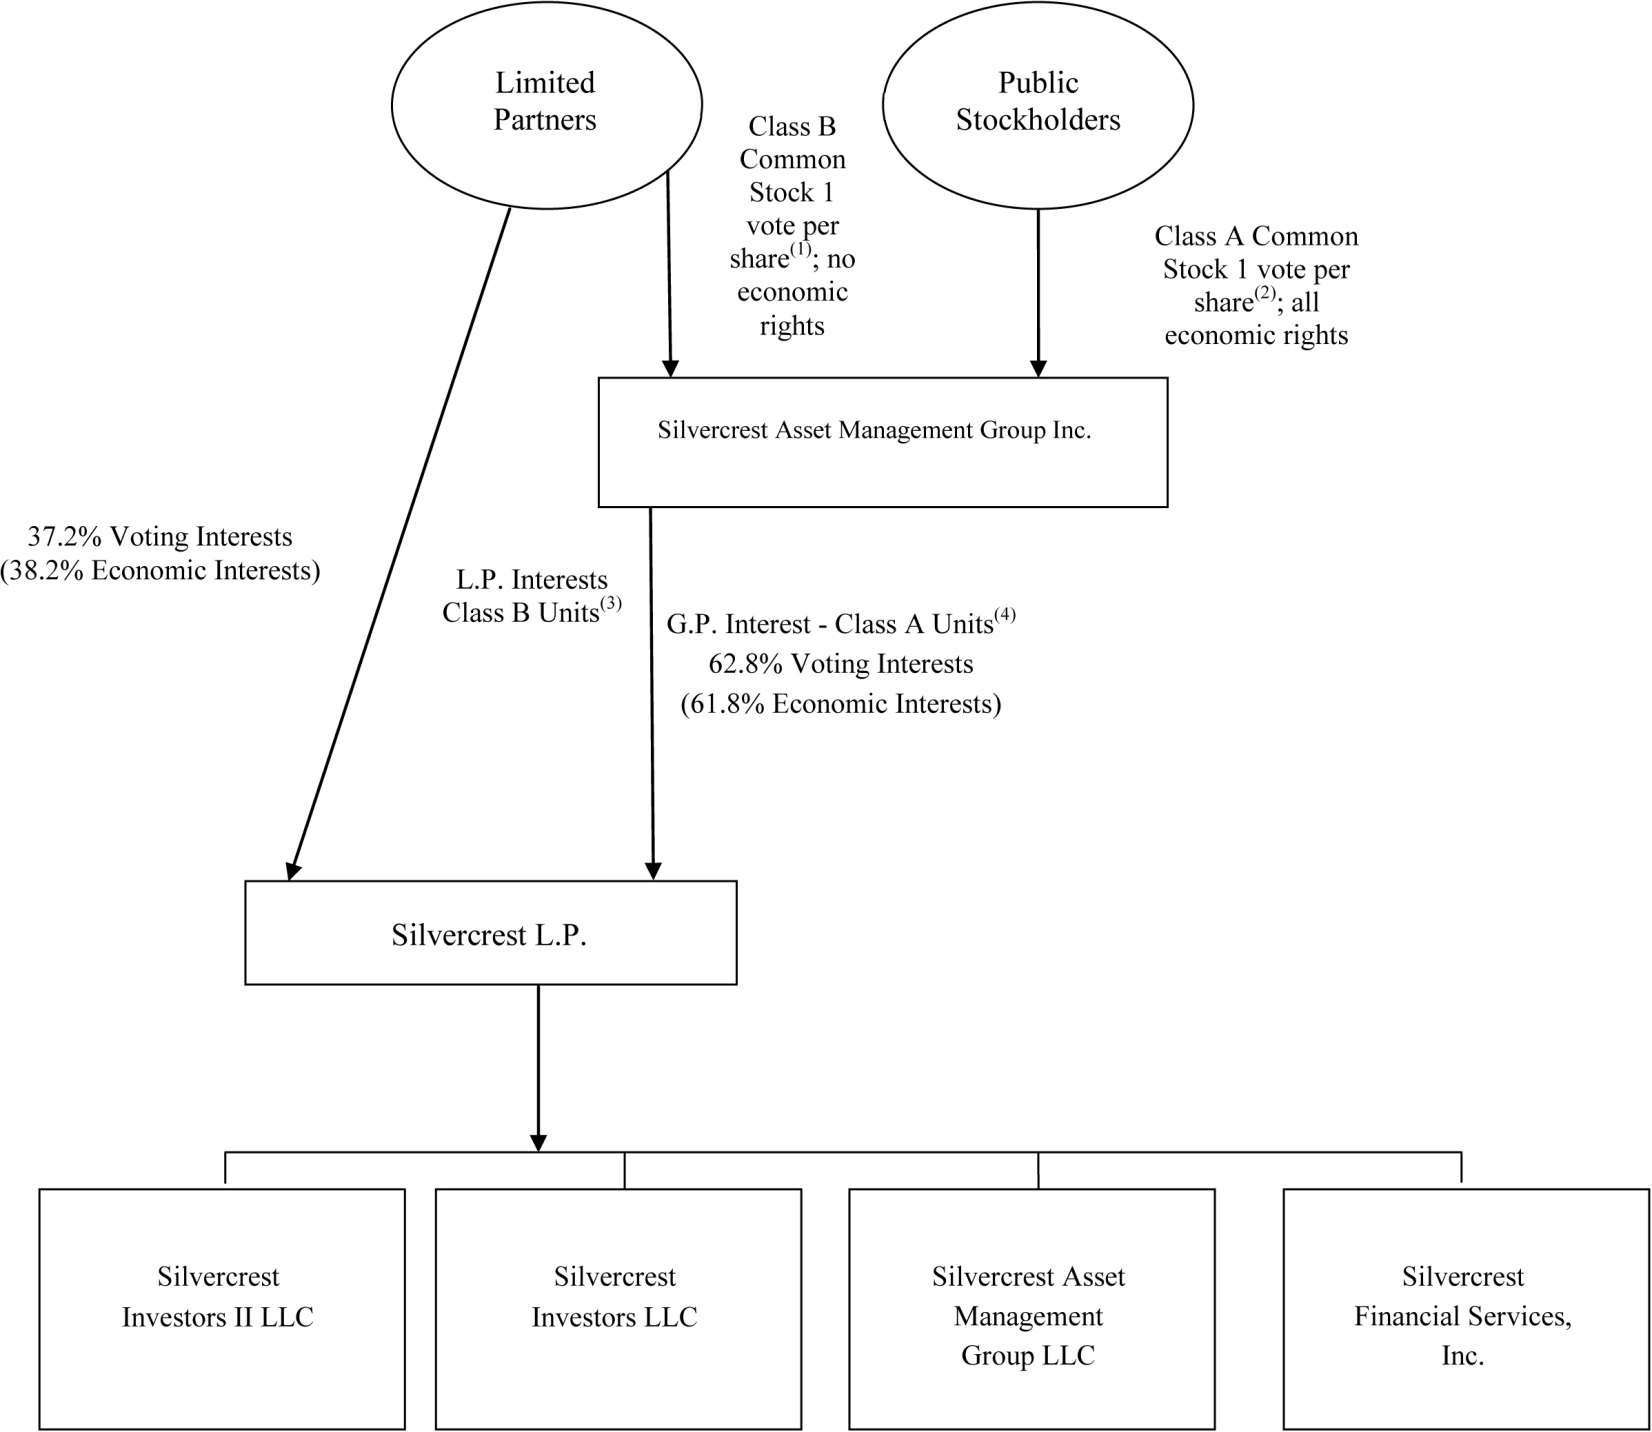
(1) |
Each share of Class B common stock is entitled to one vote per share. Class B stockholders have the right to receive the par value of the Class B common stock upon our liquidation, dissolution or winding-up. |
(2) |
Each share of Class A common stock is entitled to one vote per share. Class A common stockholders have 100% of the rights of all classes of our capital stock to receive distributions, and substantially all assets, after payment in full to creditors and holders of preferred stock, if any. |
(3) |
Each Class B unit held by a principal is exchangeable for one share of Class A common stock. The principals collectively hold 4,693,166 Class B units as of December 31, 2013, which represents the right to receive approximately 38.2% of the distributions made by Silvercrest L.P. and 175,298 deferred equity units exercisable for Class B units, which represent the right to receive approximately 1.5% of the distributions made by Silvercrest L.P. The 175,298 deferred equity units which have been issued to our principals entitle the holders thereof to participate in distributions from Silvercrest L.P. as if the underlying Class B units are outstanding and thus are taken into account to determine the economic interest of each holder of units in Silvercrest L.P. However, because the Class B units underlying the deferred equity units have not been issued and are not deemed outstanding, the holders of deferred equity units have no voting rights with respect to those Class B units. We will not issue shares of Class B common stock in respect of deferred equity units of Silvercrest L.P. until such time that the underlying Class B units are issued. |
(4) |
We hold 7,522,974 Class A units, which represents the right to receive approximately 61.8% of the distributions made by Silvercrest L.P. The 175,298 deferred equity units which have been issued to our principals entitle the holders thereof to participate in distributions from Silvercrest L.P. as if the underlying Class B units are outstanding and thus are taken into account to determine the economic interest of each holder of units in Silvercrest L.P. However, because the Class B units underlying the deferred equity units have not been issued and are not deemed outstanding, the holders of deferred equity units have no voting rights with respect to those Class B units. We will not issue shares of Class B common stock in respect of deferred equity units of Silvercrest L.P. until such time that the underlying Class B units are issued. |
13
Regulatory Environment
Our business is subject to extensive regulation in the United States at the federal level and, to a lesser extent, the state level. Under these laws and regulations, agencies that regulate investment advisers have broad administrative powers, including the power to limit, restrict or prohibit an investment adviser from carrying on its business in the event that it fails to comply with such laws and regulations. Possible sanctions that may be imposed include the suspension of individual employees, limitations on engaging in certain lines of business for specified periods of time, revocation of investment adviser and other registrations, censures and fines.
The legislative and regulatory environment in which we operate has undergone significant changes in the recent past. New laws or regulations, or changes in the enforcement of existing laws or regulations, applicable to us and our clients may adversely affect our business. Our ability to function in this environment will depend on our ability to monitor and promptly react to legislative and regulatory changes. There have been a number of highly publicized regulatory inquiries that have focused on the investment management industry. These inquiries have resulted in increased scrutiny of the industry and new rules and regulations for investment advisers. This regulatory scrutiny may limit our ability to engage in certain activities that might be beneficial to our stockholders.
In addition, as a result of recent market events, acts of serious fraud in the investment management industry and perceived lapses in regulatory oversight, U.S. and non-U.S. governmental and regulatory authorities may increase regulatory oversight of our businesses. We may be adversely affected as a result of new or revised legislation or regulations imposed by the SEC, the CFTC, other U.S. or non-U.S. regulatory authorities or self-regulatory organizations that supervise the financial markets. We also may be adversely affected by changes in the interpretation or enforcement of existing laws and rules by these governmental authorities and self-regulatory organizations, as well as by U.S. and non-U.S. courts. It is impossible to determine the extent of the impact of any new laws, regulations or initiatives that may be proposed on us or the markets in which we trade, or whether any of the proposals will become law. Compliance with any new laws or regulations could add to our compliance burden and costs and affect the manner in which we conduct our business.
SEC Regulation
SAMG LLC is registered with the SEC as an investment adviser under the Advisers Act. The Advisers Act, together with the SEC’s regulations and interpretations thereunder, imposes substantive and material restrictions and requirements on the operations of investment advisers. The SEC is authorized to institute proceedings and impose sanctions for violations of the Advisers Act, ranging from fines and censures to termination of an adviser’s registration.
The Advisers Act imposes substantive regulation on virtually all aspects of our business and relationships with our clients. As a registered investment adviser, we are subject to many requirements that cover, among other things, disclosure of information about our business to clients; maintenance of written policies and procedures; maintenance of extensive books and records; restrictions on the types of fees we may charge, including performance fees; solicitation arrangements; engaging in transactions with clients; maintaining an effective compliance program; custody of client assets; client privacy; advertising; and proxy voting. The SEC has authority to inspect any registered investment adviser and typically inspects a registered investment adviser periodically to determine whether the adviser is conducting its activities (i) in accordance with applicable laws, (ii) consistent with disclosures made to clients and (iii) with adequate systems and procedures to ensure compliance.
As an investment adviser, we have a fiduciary duty to our clients. The SEC has interpreted this duty to impose standards, requirements and limitations on, among other things: trading for proprietary, personal and client accounts; allocations of investment opportunities among clients; use of soft dollars; execution of transactions; and recommendations to clients. We manage 64% of our accounts on a discretionary basis, with authority to buy and sell securities for each portfolio, select broker-dealers to execute trades and negotiate brokerage commission rates. In connection with these transactions, we receive soft dollar credits from broker-dealers that have the effect of reducing certain of our expenses. Section 28(e) of the Exchange Act provides a “safe harbor” to an investment adviser against claims that it breached its fiduciary duty under state or federal law (including ERISA) solely because the adviser caused its clients’ accounts to pay more than the lowest available commission for executing a securities trade in return for brokerage and research services. To rely on the safe harbor offered by Section 28(e), (i) we must make a good-faith determination that the amount of commissions is reasonable in relation to the value of the brokerage and research services being received and (ii) the brokerage and research services must provide lawful and appropriate assistance to us in carrying out our investment decision-making responsibilities. In permissible circumstances, we may receive technology-based research, market quotation and/or market survey services which are paid for in whole or in part by soft dollar brokerage arrangements. If our ability to use soft dollars were reduced or eliminated as a result of the implementation of statutory amendments or new regulations, our operating expenses would increase.
Under the Advisers Act, our investment management agreements may not be assigned without the client’s consent. The term “assignment” is broadly defined and includes direct assignments as well as assignments that may be deemed to occur upon the transfer, directly or indirectly, of a controlling interest in an investment adviser.
14
The failure of SAMG LLC to comply with the requirements of the Advisers Act, and the regulations and interpretations thereunder, could have a material adverse effect on us.
CFTC Regulation
Due to recent rule amendments by the CFTC, SAMG LLC is registered with the CFTC and the National Futures Association, or the NFA, as a commodity pool operator and/or commodity trading advisor. Registration subjects us and our affiliates to substantive and material restrictions and requirements, including, among other things, reporting, recordkeeping, disclosure, self-examination and training requirements. Registration also subjects us to periodic on-site audits, and the CFTC is authorized to institute proceedings and impose sanctions for violations of the Commodity Exchange Act and/or CFTC rules.
Dodd-Frank
The Dodd-Frank Wall Street Reform and Consumer Protection Act, or the Dodd-Frank Act, was signed into law on July 21, 2010. While we do not at this time believe that the Dodd-Frank Act will cause us to reconsider our basic strategy, it does appear that certain provisions will, and other provisions may, increase regulatory burdens related to compliance costs. The scope of many provisions of the Dodd-Frank Act have been, or will be, determined by implementing regulations, some of which will require lengthy proposal and promulgation periods.
Pursuant to the mandate of the Dodd-Frank Act, the SEC and the CFTC have adopted certain reporting requirements that require us to report certain information about a number of our private funds, commodity pools and commodity trading advisers, including regulations promulgated under the authority given to the SEC and CFTC under Sections 404 and 406 of the Dodd-Frank Act requiring a Form-PF and/or a CTA-PQR and CTA-PR to be filed by us. These filings have required and will continue to require investments in people and systems to assure timely and accurate reporting. Further, we will need to monitor compliance with new SEC and CFTC rules concerning swaps and other derivatives including, among other things, designated trading venues, mandated central clearing arrangements, and other conduct requirements.
The Dodd-Frank Act will affect a broad range of market participants with whom we interact or may interact. Regulatory changes that will affect other market participants are likely to change the way in which we conduct business with our counterparties. Although many aspects of the Dodd-Frank Act have been implemented, there remains significant uncertainty regarding implementation of other aspects of the Dodd-Frank Act, and its impact on the investment management industry and us cannot be predicted at this time, but will continue to be a risk for our business.
ERISA-Related Regulation
To the extent that SAMG LLC or any other of our affiliates is a “fiduciary” under ERISA with respect to benefit plan clients, it is subject to ERISA and to regulations promulgated thereunder. Among other things, ERISA and applicable provisions of the Internal Revenue Code impose certain duties on persons who are fiduciaries under ERISA, prohibit certain transactions involving benefit plan clients and provide monetary penalties for violations of these prohibitions. Our failure to comply with these requirements could have a material adverse effect on our business.
Compliance
Our legal and compliance functions are integrated into a team of professionals. This group is responsible for all legal and regulatory compliance matters, as well as monitoring adherence to client investment guidelines. Senior management is involved at various levels in all of these functions.
Risks Related to our Investment Performance and the Financial Markets
Volatile market conditions could adversely affect our business in many ways, including by reducing the value of our assets under management and causing clients to withdraw funds, either of which could materially reduce our revenues and adversely affect our financial condition.
The fees we earn under our investment management agreements with clients are based on the value of our assets under management. The prices of the securities held in the portfolios we manage and, therefore, our assets under management, may decline due to any number of factors beyond our control, including, among others, a declining stock or bond market, general economic downturn, political uncertainty or acts of terrorism. In connection with the severe market dislocations of 2008 and early 2009, the value of our assets under management declined substantially due primarily to the significant decline in stock prices worldwide. In future periods of difficult market conditions we may experience accelerated client redemptions or withdrawals if clients move assets to investments they perceive as offering greater opportunity or lower risk, which could further reduce our assets under management in
15
addition to market depreciation. The economic outlook remains uncertain and we continue to operate in a challenging business environment. If market conditions, or actions taken by clients in response to market conditions, cause a decline in our assets under management, it would result in lower investment management fees and other revenue. If our revenues decline without a commensurate reduction in our expenses, our net income will be reduced and our business will be negatively affected.
If market conditions improve greatly, driving the prices of the securities in our clients’ accounts higher, it may lead to withdrawals or redemptions. In many cases, we advise only a portion of our clients’ complete financial portfolio. This is because many clients prefer to diversify their portfolio among more than one asset manager or investment type. As to those clients, if the portion of their portfolio held by us increases significantly, it may become too large a percentage of their overall portfolio, and they may withdraw assets from our management and invest it elsewhere, thereby rebalancing their overall portfolio and returning their allocation to us to its prior level.
If our investment strategies perform poorly, clients could withdraw their assets and we could suffer a decline in our assets under management and/or become the subject of litigation, either of which would reduce our earnings.
The performance of our investment strategies is critical in retaining existing client assets as well as attracting new client assets. If our investment strategies perform poorly for any reason on an absolute basis or relative to other investment advisers, or the rankings of mutual funds we sub-advise decline, our earnings could decline because:
· | our existing clients may withdraw funds from our investment strategies or terminate their relationships with us, or investors in the mutual funds we sub-advise may redeem their investments, which would cause a decline in the revenues that we generate from investment management and other fees; or |
· | third-party financial intermediaries, advisers or consultants may rate our investment products poorly, which may lead our existing clients to withdraw funds from our investment strategies or reduce asset inflows from these third parties or their clients. |
Our investment strategies can perform poorly for a number of reasons, including general market conditions, investment decisions that we make and the performance of the companies in which we invest on behalf of our clients. In addition, while we seek to deliver long-term value to our clients, volatility may lead to under-performance in the near term, which could adversely affect our results of operations.
While clients do not generally have legal recourse against us solely on the basis of poor investment results, if our investment strategies perform poorly, we are more likely to become subject to litigation brought by dissatisfied clients. In addition, to the extent clients are successful in claiming that their losses resulted from fraud, gross negligence, willful misconduct, breach of contract or other similar misconduct, these clients may have remedies against us and/or our investment professionals under the federal securities laws and/or state law.
The historical returns of our existing investment strategies may not be indicative of their future results or of the future results of investment strategies we may develop in the future.
We have presented the historical returns of our existing investment strategies outlined under “Business” in this report. The historical returns of our strategies should not be considered indicative of the future results of these strategies or of the results of any other strategies that we may develop in the future. The investment performance we achieve for our clients varies over time and the variance can be wide. The historical performance presented herein is as of December 31, 2013 and for periods then ended. The performance we achieve as of a subsequent date and for a subsequent period may be higher or lower and the difference may be material. Our strategies’ returns have benefited during some periods from investment opportunities and positive economic and market conditions. In other periods, such as in 2008, the first quarter of 2009 and the second quarter of 2010, general economic and market conditions have negatively affected investment opportunities and our strategies’ returns. These negative conditions may occur again, and in the future, we may not be able to identify and invest in profitable investment opportunities within our current or future strategies.
We derive a substantial portion of our revenues from a limited number of our strategies.
As of December 31, 2013, $9.3 billion of our assets under management were concentrated in discretionary managed accounts, and the revenue from these discretionary managed accounts represents approximately 83% of our investment management fees for the twelve months ended December 31, 2013. In addition, $0.8 billion of our assets under management were invested in private partnerships, as of December 31, 2013, the revenue from these private partnerships representing approximately 17% of our investment management fees for the twelve months ended December 31, 2013. As a result, a substantial portion of our operating results depends upon the performance of a limited number of investment strategies used to manage those discretionary managed accounts and private partnerships, and our ability to retain client assets. If a significant portion of the investors in our larger strategies decided to withdraw their investments or terminate their investment management agreements for any reason, including poor investment performance or adverse market conditions, our revenues from those strategies would decline, which would have a material adverse effect on our results of operations and financial condition.
16
A significant portion of our assets under management are or may be derived from a small number of clients, the loss of which could significantly reduce our management fees and have a material adverse effect on our results of operations.
Certain of our strategies are or may derive a significant portion of their total assets under management from assets of a single client or a small number of clients. If any such clients withdraw all or a portion of their assets under management, our business would be significantly affected, which would negatively impact our management fees and could have a material adverse effect on our results of operations and financial condition.
We may not be able to maintain our current fee structure as a result of poor investment performance, competitive pressures or as a result of changes in our business mix, which could have a material adverse effect on our profit margins and results of operations.
We may not be able to maintain our current fee structure for any number of reasons, including as a result of poor investment performance, competitive pressures or changes in our business mix. In recent years, there has been a general trend toward lower fees in the investment management industry, and some of our investment strategies, because they tend to invest in larger-capitalization companies and were designed to have larger capacity and to appeal to larger clients, have lower fee schedules. In order to maintain our fee structure in a competitive environment, we must be able to continue to provide clients with investment returns and service that our clients believe justify our fees. We may not succeed in providing the investment returns and service that will allow us to maintain our current fee structure. If our investment strategies perform poorly, we may be forced to lower our fees in order to retain current, and attract additional, assets to manage. Furthermore, if a larger part of our assets under management are invested in our larger capacity, lower fee strategies, our revenue could be adversely affected.
We derive most of our revenues from assets under management that may be reduced at any time by our clients.
We derive our revenues principally from our assets under management, which may be reduced by our clients, or investors in the mutual funds we sub-advise, at any time. A client may reduce his assets under management with us by re-allocating all or any portion of the assets that we manage away from us at any time with little or no notice. In addition, investors in the mutual funds we advise can redeem their investments in those funds at any time without prior notice. A client may also reduce his assets under management with us through the termination of his investment advisory agreement with us. Our investment advisory agreements are terminable by our clients upon short notice or no notice. These investment management agreements and client relationships may be terminated or not renewed for any number of reasons. The decrease in revenues that could result from a reduction in assets under management or the termination of a material client relationship or group of client relationships could have a material adverse effect on our business.
The long-only, equity investment focus of the majority of our strategies exposes us to greater risk than certain of our competitors whose investment strategies may also include non-equity securities or hedged positions.
Our largest equity investment strategies hold long positions in publicly-traded equity securities of companies across a wide range of market capitalizations, geographies and industries. Accordingly, under market conditions in which there is a general decline in the value of equity securities, each of our equity strategies is likely to perform poorly on an absolute basis. Aside from our privately managed funds and funds of funds, we do not have strategies that invest in privately-held companies or take short positions in equity securities, which could offset some of the poor performance of our long-only, equity strategies under such market conditions. Even if our investment performance remains strong during such market conditions relative to other long-only, equity strategies, investors may choose to withdraw assets from our management or allocate a larger portion of their assets to non-long-only or non-equity strategies. In addition, the prices of equity securities may fluctuate more widely than the prices of other types of securities, making the level of our assets under management and related revenues more volatile.
The performance of our investment strategies or the growth of our assets under management may be constrained by the unavailability of appropriate investment opportunities or if we close certain of our investment strategies.
The ability of our investment teams to deliver strong investment performance depends in large part on their ability to identify appropriate investment opportunities in which to invest client assets. If the investment team for any of our strategies is unable to identify sufficiently appropriate investment opportunities for existing and new client assets on a timely basis, the investment performance of the strategy could be adversely affected. In addition, if we determine that there are insufficient investment opportunities available for a strategy, we may choose to limit the growth of the strategy by limiting the rate at which we accept additional client assets for management under the strategy, closing the strategy to all or substantially all new investors or otherwise taking action to limit the flow of assets into the strategy. If we misjudge the point at which it would be optimal to limit access to or close a strategy, the investment performance of the strategy could be negatively impacted. The risk that sufficiently appropriate investment opportunities may be unavailable is influenced by a number of factors, including general market conditions, but is particularly acute with respect to our Small Cap and SMID Cap strategies that focus on small-cap investments, and is likely to increase as our assets under management increase, particularly if these increases occur very rapidly. If we are unable to identify appropriate investment opportunities in which to invest client assets, our growth and results of operations may be negatively affected.
17
Our investment strategies may not obtain attractive returns in the short-term or during certain market periods.
Our products are best suited for investors with long-term investment horizons. In order for our classic value investment approach to yield attractive returns, we must typically hold securities for an average of over three years. Therefore, our investment strategies may not perform well during short periods of time. In addition, our strategies may not perform well during points in the economic cycle when value-oriented stocks are relatively less attractive. For instance, during the late stages of an economic cycle, investors may purchase relatively expensive stocks in order to obtain access to above average growth, as was the case in the late 1990s. Value-oriented strategies may also experience weakness during periods when the markets are focused on one investment thesis or sector. For example, in the past two years, the markets have deemed many businesses producing commodities and basic materials to be sound investments, regardless of their prices, based on the thesis that the rapid growth of such large economies as China and India means that there will be constant shortfalls in the supply of the goods produced by these companies. We would not invest in these companies if their stocks were not inexpensively priced, thus foregoing potentially attractive returns during the periods when these companies’ stock prices are continuing to advance.
Our investment approach may underperform other investment approaches, which may result in significant withdrawals of client assets, client departures or a reduction in our assets under management.
Even when securities prices are rising generally, portfolio performance may be affected by our investment approach. We employ a long-term investment approach in all of our investment strategies. This investment approach has outperformed the market in some economic and market environments and underperformed it in others. In particular, a prolonged period in which the growth style of investing outperforms the value style may cause our investment strategy to go out of favor with some clients, consultants or third-party intermediaries. Poor performance relative to peers, coupled with changes in personnel, extensive periods in particular market environments or other difficulties may result in significant withdrawals of client assets, client departures or a reduction in our assets under management.
Our investment process requires us to conduct extensive fundamental research on any company before investing in it, which may result in missed investment opportunities and reduce the performance of our investment strategies.
We take a considerable amount of time to complete the in-depth research projects that our investment process requires before adding any security to our portfolio. Our process requires that we take this time in order to understand the company and the business well enough to make an informed decision whether we are willing to own a significant position in a company whose current earnings are below its historic norms and that does not yet have earnings visibility. However, the time we take to make this judgment may cause us to miss the opportunity to invest in a company that has a sharp and rapid earnings recovery. Any such missed investment opportunities could adversely impact the performance of our investment strategies.
Our Core International Equity Strategy invests principally in the securities of non-U.S. companies, which involve foreign currency exchange, tax, political, social and economic uncertainties and risks.
As of December 31, 2013, our Core International Equity Strategy, which invests in companies domiciled outside of the United States, accounted for approximately 0.6% of our assets under management. In addition, some of our other strategies also invest on a more limited basis in securities of non-U.S. companies. Fluctuations in foreign currency exchange rates could negatively affect the returns of our clients who are invested in these strategies. In addition, an increase in the value of the U.S. dollar relative to non-U.S. currencies is likely to result in a decrease in the U.S. dollar value of our assets under management, which, in turn, could result in lower revenue since we report our financial results in U.S. dollars.
Investments in non-U.S. issuers may also be affected by tax positions taken in countries or regions in which we are invested, as well as political, social and economic uncertainty, particularly as a result of the recent decline in economic conditions. Declining tax revenues may cause governments to assert their ability to tax the local gains and/or income of foreign investors (including our clients), which could adversely affect clients’ interests in investing outside the United States. Many financial markets are not as developed, or as efficient, as the U.S. financial markets, and, as a result, those markets may have limited liquidity and higher price volatility. Liquidity also may be adversely affected by political or economic events within a particular country, and our ability to dispose of an investment also may be adversely affected if we increase the size of our investments in smaller non-U.S. issuers. Non-U.S. legal and regulatory environments, including financial accounting standards and practices, also may be different, and there may be less publicly available information about such companies. These risks could adversely affect the performance of our Core International Equity Strategy and may be particularly acute in the emerging or less developed markets in which we invest.
18
Risks Related to our Key Professionals
The loss of key investment professionals or members of our senior management team could have a material adverse effect on our business.
We depend on the skills and expertise of our investment professionals and our success depends on our ability to retain the key members of our senior management and investment teams, who possess substantial experience in investing and have been primarily responsible for the historically strong investment performance we have achieved. In particular, we depend on our portfolio managers. As of December 31, 2013, $5.5 billion, representing 35% of our assets under management, were managed using one of our proprietary equity strategies. Our five largest strategies as of December 31, 2013 were Large Cap, Small Cap, Multi Cap, Equity Income and Focused Value which represented 10%, 9%, 7%, 6% and 1% of assets under management, respectively. Each of these five strategies has been managed by its current portfolio manager since its inception at Silvercrest.
Because of the long tenure and stable track record of our portfolio managers, our clients may attribute the investment performance we have achieved to these individuals. While we have generally experienced very few departures among our portfolio managers, there can be no assurance that this stability will continue in the future. The departure of one of a strategy’s portfolio managers could cause clients to withdraw funds from the strategy, which would reduce our assets under management, our investment management and other fees and, if we were not able to reduce our expenses sufficiently, our net income, and these reductions could be material to our business. The departure of one of a strategy’s portfolio managers also could cause clients to refrain from allocating additional funds to the strategy or delay such allocation of additional funds until a sufficient track record under a new portfolio manager or managers has been established. This would have a negative effect on the future growth of our assets under management and, therefore, our results of operations.
Our former Chief Executive Officer, G. Moffett Cochran, passed away on November 18, 2013. We continue to depend on the contributions of our senior management team led by Richard R. Hough, our new Chief Executive Officer, as well as other members of our senior management team. In addition, our senior marketing and client service personnel have direct contact with our clients and their consultants and advisors and other key individuals within each of our distribution channels. The loss of any of these key professionals could limit our ability to successfully execute our business strategy, prevent us from sustaining the historically strong investment performance and adversely affect our ability to retain or attract client assets.
If any member of our senior management or a key investment professional were to join a competitor or form a competing company, some of our current clients or other prominent members of the investing community could choose to invest with that competitor rather than us.
Any of our investment or management professionals may resign at any time, join our competitors or form a competing company. Although the unvested shares of Class A common stock and Class B units held by our principals are subject to forfeiture, and the vested shares of Class A common stock and Class B units held by our principals are subject to repurchase, if the principal voluntarily resigns or retires and competes with us while employed or during the 12-month period following termination of employment, these forfeiture and repurchase provisions may not be enforceable or may not be enforceable to their full extent. We do not carry “key man” insurance on any of our key investment professionals that would provide us with proceeds in the event of the death or disability of any of the key members of our investment or management teams.
The professional reputations, expertise in investing and client relationships of our senior management and key investment professionals are important elements to executing our business strategy and attracting and retaining clients. Accordingly, the retention of our senior management and key investment professionals is a key element to our future success. There is no guarantee that they will not resign, join our competitors or form a competing company. The terms of the second amended and restated limited partnership agreement of Silvercrest L.P. restrict each of the principals of Silvercrest L.P. from soliciting our clients or other employees during the term of their employment with us and for 18 months thereafter. In addition to the legal rights and remedies available to us to enforce these restrictive covenants, the penalty for a breach of these restrictive covenants or, if a principal voluntarily resigns or retires from our company, for competing with us during the 12-month period following termination of employment, will be the forfeiture of all of the unvested shares of Class A common stock and Class B units of the offending party and his or her permitted transferees and, at the option of Silvercrest L.P., the required sale to Silvercrest L.P. of all of the vested Class B units of the offending party and his or her permitted transferees at a purchase price equal to the lesser of (i) the aggregate capital account balance of the offending party and his or her permitted transferees in Silvercrest L.P. and (ii) the purchase price paid by the offending party to first acquire the Class B units, and, at our option, the required sale to us of all of the Class A common stock collectively held by the offending party and his or her permitted transferees at a purchase price equal to the purchase price paid by the offending party to first acquire the Class B units for which such shares of Class A common stock had been exchanged. Although we also would likely seek specific performance of these restrictive covenants, there can be no assurance that we would be successful in obtaining this relief. Further, after this post-employment restrictive period, we will not be able to prohibit a departed professional from soliciting our clients or employees. If any of our principals were to join a competitor or form a competing company, some of our current clients or other prominent members of the investing community could choose to invest with that competitor rather than us or otherwise withdraw assets from our company which could have a negative impact on our results of operations.
19
Competition for qualified investment, management and marketing and client service professionals is intense and we may fail to successfully attract and retain qualified personnel in the future.
Our ability to attract and retain qualified personnel will depend heavily on the amount and structure of compensation and opportunities for equity ownership we offer. Historically we have offered key employees equity ownership through interests in Silvercrest L.P. Those key employees who are currently limited partners of Silvercrest L.P. hold these interests in the form of Class B units. We expect our compensation structure to include a combination of cash and equity-based incentives as appropriate. Although we intend for overall compensation levels to remain commensurate with amounts paid to our key employees in the past, we may not be successful in designing and implementing an attractive compensation model. Any cost-reduction initiative or adjustments or reductions to compensation could negatively impact our ability to retain key personnel. In addition, changes to our management structure, corporate culture and corporate governance arrangements, including the changes associated with, and resulting from, our reorganization and becoming a public company, could negatively impact our ability to retain key personnel. If we are unable to retain key personnel, our results of operations may be negatively affected.
Risks Related to the Regulatory Environment in which We Operate
We are subject to extensive regulation that imposes numerous obligations on our business.
We are subject to extensive regulation in the United States, primarily at the federal level, including regulation by the SEC under the Investment Advisers Act of 1940, as amended, or the Advisers Act, by the CFTC, and by the NFA under the Commodity Exchange Act, by the U.S. Department of Labor under the Employee Retirement Income Security Act of 1974, or ERISA, and Nasdaq. The Advisers Act and the Commodity Exchange Act impose numerous obligations on us including advertising, recordkeeping and operating requirements, disclosure obligations and prohibitions on fraudulent activities. In addition, we regularly rely on exemptions from various requirements of the Securities Act of 1933, as amended, or the Securities Act, the Securities Exchange Act of 1934, as amended, or the Exchange Act, the Investment Company Act of 1940, as amended, or the Investment Company Act, and ERISA. These exemptions are sometimes highly complex and may in certain circumstances depend on compliance by third parties whom we do not control. If for any reason these exemptions were to be revoked or challenged or otherwise become unavailable to us, we could be subject to regulatory action or third-party claims, and our business could be materially and adversely affected.
In the future, we may further expand our business outside of the United States in such a way or to such an extent that we may be required to register with additional foreign regulatory agencies or otherwise comply with additional non-U.S. laws and regulations that do not currently apply to us and with respect to which we do not have compliance experience. Our lack of experience in complying with any such non-U.S. laws and regulations may increase our risk of becoming party to litigation and subject to regulatory actions.
Our business is highly regulated in the United States, and has seen a significant increase of regulatory oversight in recent years. Some of the newly adopted and proposed regulations are focused directly on the investment management industry, while others broadly impact our industry.
While we do not at this time believe that the Dodd-Frank Act will cause us to reconsider our basic strategy, it does appear that certain provisions will, and other provisions may, increase regulatory burdens related to compliance costs. The scope of many provisions of the Dodd-Frank Act have been, or will be, determined by implementing regulations, some of which will require lengthy proposal and promulgation periods.
Pursuant to the mandate of the Dodd-Frank Act, the SEC and the CFTC have adopted certain reporting requirements that require us to report certain information about a number of our private funds, commodity pools and commodity trading advisers, including regulations promulgated under the authority given to the SEC and CFTC under Sections 404 and 406 of the Dodd-Frank Act requiring a Form-PF and/or a CTA-PQR and CTA-PR to be filed by us. These filings have required and will continue to require investments in people and systems to assure timely and accurate reporting. Further, we will need to monitor compliance with new SEC and CFTC rules concerning swaps and other derivatives including, among other things, designated trading venues, mandated central clearing arrangements, and other conduct requirements.
The Dodd-Frank Act will affect a broad range of market participants with whom we interact or may interact. Regulatory changes that will affect other market participants are likely to change the way in which we conduct business with our counterparties. Although many aspects of the Dodd-Frank Act have been implemented, there remains significant uncertainty regarding implementation of other aspects of the Dodd-Frank Act, and its impact on the investment management industry and us cannot be predicted at this time but will continue to be a risk for our business.
Accordingly, we face the risk of significant intervention by regulatory authorities, including extended investigation and surveillance activity, adoption of costly or restrictive new regulations and judicial or administrative proceedings that may result in substantial penalties. Among other things, we could be fined or be prohibited from engaging in some of our business activities. The requirements imposed by our regulators, other than the Exchange Act and the Nasdaq rules, are generally designed to ensure the integrity of the financial markets and to protect clients and other third parties who deal with us, and are generally not designed to protect our stockholders. Consequently, these regulations often serve to limit our activities, including through net capital, customer
20
protection and market conduct requirements. Moreover, recent extreme volatility events in the U.S. equities markets have led to heightened scrutiny of sophisticated trading technology and execution methods.
The regulatory environment in which we operate is subject to continuous change, and regulatory developments designed to increase oversight may adversely affect our business.
The legislative and regulatory environment in which we operate has undergone significant changes in the recent past, including additional filings with the SEC and the CFTC required by investment advisors, which have resulted in increased costs to the Company. We believe that significant regulatory changes in our industry are likely to continue, which is likely to subject industry participants to additional, more costly and generally more detailed regulation. New laws or regulations, or changes in the enforcement of existing laws or regulations, applicable to us and our clients may adversely affect our business. Our ability to function in this environment will depend on our ability to monitor and promptly react to legislative and regulatory changes. There have been a number of highly publicized regulatory inquiries that have focused on the investment management industry. These inquiries already have resulted in increased scrutiny of the industry and new rules and regulations for investment advisers. This regulatory scrutiny may limit our ability to engage in certain activities that might be beneficial to our stockholders.
In addition, as a result of the recent economic downturn, acts of serious fraud in the investment management industry and perceived lapses in regulatory oversight, U.S. and non-U.S. governmental and regulatory authorities may increase regulatory oversight of our businesses. We may be adversely affected as a result of new or revised legislation or regulations imposed by the SEC, the CFTC, other U.S. or non-U.S. governmental regulatory authorities or self-regulatory organizations that supervise the financial markets. We also may be adversely affected by changes in the interpretation or enforcement of existing laws and rules by these governmental authorities and self-regulatory organizations, as well as by U.S. and non-U.S. courts. It is impossible to determine the extent of the impact of any new laws, regulations or initiatives that may be proposed on us or the markets in which we trade, or whether any of the proposals will become law. Compliance with any new laws or regulations could add to our compliance burden and costs and affect the manner in which we conduct business.
We could be subject to regulatory investigations, which could harm our reputation and cause our funds to lose existing investors or us to lose existing accounts or fail to attract new investors or accounts.
The failure by us to comply with applicable laws or regulations could result in fines, suspensions of individual employees or other sanctions. Even if an investigation or proceeding did not result in a fine or sanction or the fine or sanction imposed against us or our employees by a regulator were small in monetary amount, the adverse publicity relating to an investigation, proceeding or imposition of these fines or sanctions could harm our reputation and cause our funds to lose existing investors or us to lose existing accounts or fail to attract new investors or accounts.
Failure to comply with “pay to play” regulations implemented by the SEC and certain states, and changes to the “pay to play” regulatory regimes, could adversely affect our business.
The SEC and several states have initiated investigations alleging that certain private equity firms and hedge funds or agents acting on their behalf have paid money to current or former government officials or their associates in exchange for improperly soliciting contracts with state pension funds. The SEC has also recently initiated a similar investigation into contracts awarded by sovereign wealth funds. The SEC approved Rule 206(4)-5 under the Advisers Act regarding “pay to play” practices by investment advisers involving campaign contributions and other payments to government officials able to exert influence on potential government entity clients. Among other restrictions, the rule prohibits investment advisers from providing advisory services for compensation to a government entity for two years, subject to very limited exceptions, after the investment adviser, its senior executives or its personnel involved in soliciting investments from government entities have made contributions to certain candidates and officials in a position to influence the hiring of an investment adviser by such government entity. Advisers are required to implement compliance policies designed, among other matters, to track contributions by certain of the adviser’s employees and engagements of third parties that solicit government entities (and political action committees controlled by such persons) and to keep certain records in order to enable the SEC to determine compliance with the rule. Additionally, California enacted legislation that requires placement agents (including in certain cases employees of investment managers) who solicit funds from California state retirement systems, such as the California Public Employees’ Retirement System and the California State Teachers’ Retirement System, to register as lobbyists, thereby becoming subject to increased reporting requirements and prohibited from receiving contingent compensation for soliciting investments from California state retirement systems. There also has been similar rulemaking in New York and other states. Such additional regulations may require the attention of senior management and may result in fines if any of our funds are deemed to have violated any regulations, thereby imposing additional expenses on us. Any failure on our part to comply with these rules could cause us to lose compensation for our advisory services or expose us to significant penalties and reputational damage.
21
Risks Related to Our Growth
Our efforts to establish new investment teams and strategies may be unsuccessful and could negatively impact our results of operations and our reputation.
As part of our growth strategy, we may seek to take advantage of opportunities to add new investment teams that invest in a way that is consistent with our philosophy of offering high value-added investment strategies. To the extent we are unable to recruit and retain investment teams that will complement our existing business model, we may not be successful in further diversifying our investment strategies and client assets, any of which could have a material adverse effect on our business and future prospects. In addition, the costs associated with establishing a new team and investment strategy initially will exceed the revenues they generate. If any such new strategies perform poorly and fail to attract sufficient assets to manage, our results of operations will be negatively impacted. A new strategy’s poor performance also may negatively impact our reputation and the reputation of our other investment strategies within the investment community.
We may enter into new lines of business, make strategic investments or acquisitions or enter into joint ventures, each of which may result in additional risks and uncertainties for our business.
The second amended and restated limited partnership agreement of Silvercrest L.P. permits us to enter into new lines of business, make future strategic investments or acquisitions and enter into joint ventures. As we have in the past, and subject to market conditions, we may grow our business through increasing assets under management in existing investment strategies, pursue new investment strategies, which may be similar or complementary to our existing strategies or be wholly new initiatives, consummating acquisitions of other investment advisers or entering into joint ventures.
To the extent we make strategic investments or acquisitions, enter into strategic relationships or joint ventures or enter into new lines of business, we will face numerous risks and uncertainties, including risks associated with the required investment of capital and other resources and with combining or integrating operational and management systems and controls and managing potential conflicts. Entry into certain lines of business may subject us to new laws and regulations with which we are not familiar, or from which we are currently exempt, and may lead to increased litigation and regulatory risk. If a new business generates insufficient revenues, or produces investment losses, or if we are unable to efficiently manage our expanded operations, our results of operations will be adversely affected, and our reputation and business may be harmed. In the case of joint ventures, we are subject to additional risks and uncertainties in that we may be dependent upon, and subject to liability, losses or reputational damage relating to, systems, controls and personnel that are not under our control.
We may be unable to successfully execute strategic investments or acquisitions or enter into joint ventures, and we may fail to successfully integrate and operate new investment teams, which could limit our ability to grow assets under management and adversely affect our results of operations.
We have not at this time entered into any binding agreements with respect to any strategic investments or acquisitions or any strategic relationships or joint ventures and we cannot assure you that we will actually make any additional acquisitions. Our ability to execute our acquisition strategy will depend on our ability to identify new lines of businesses or new investment teams that meet our investment criteria and to successfully negotiate with the owners/managers who may not wish to give up control of the target fund general partner or managing member, as the case may be. We cannot be certain that we will be successful in finding new investment teams or investing in new lines of business or that they will have favorable operating results following our acquisitions.
Moreover, our future acquisition strategies may focus on privately-held asset managers that pursue single strategy specialized investments. This approach presents challenges, including the lack of publicly available information, and greater risks than are generally associated with transactions with more traditional asset managers. The asset managers that we may acquire and their financial information may not be subject to the reporting requirements and other rules that govern public companies, including the Sarbanes-Oxley Act of 2002, or Sarbanes-Oxley. Moreover, such asset managers may not be subject to regulation under the Advisers Act and/or the Commodity Exchange Act at the time we acquire them. As a result, such asset managers could be more susceptible to irregular accounting or fraudulent practices. The targets we seek to acquire in the future may have shorter operating histories than us on which to estimate future performance and may not have significant or any operating revenues. They also may have a lower capitalization and fewer resources (including cash) and be more vulnerable to failure than traditional asset managers. We will be required to rely on the ability of the professionals employed by us to obtain adequate information to evaluate the manager affiliates we seek to acquire.
In addition, our ability to acquire asset managers on favorable terms and successfully integrate and operate them is subject to the following significant risks:
· | we may acquire asset managers that are not accretive to our financial results upon acquisition, and we may not successfully manage acquired funds to meet our expectations; |
· | we may be unable to generate sufficient management fees from operations or obtain the necessary debt or equity financing to consummate an acquisition on favorable terms or at all; |
22
· | agreements for the acquisition of such asset managers will typically be subject to customary conditions to closing, including satisfactory completion of due diligence investigations and negotiation of ancillary documentation, and we may spend significant time and money on potential acquisitions that we do not consummate; |
· | the process of acquiring or pursuing the acquisition of such asset managers may divert the attention of our management team from the operations of our business and our initial funds; |
· | we will need to attract, hire, train, supervise and manage new employees as a result of the acquisitions of asset managers; |
· | we may acquire such asset managers without any recourse, or with only limited recourse, for liabilities, whether known or unknown, such as claims against the former owners of the asset managers and claims for indemnification by the asset managers, limited partners and others indemnified by the former owners of the managers of the funds; and |
· | we may be unable to quickly and efficiently integrate new acquisitions into our existing operations. |
If we cannot complete acquisitions of such asset managers on favorable terms, or integrate or operate new investment teams to meet our goals or expectations, our financial condition, results of operations, cash flow, trading price of our common stock and ability to satisfy any debt service obligations and to pay distributions could be adversely affected. Additionally, any acquisitions that we make generally will not be subject to our stockholders’ consent. These factors increase the risk of investing in our Class A common stock.
The due diligence process that we undertake in connection with strategic investments or acquisitions or entry into joint ventures may not reveal all facts that may be relevant in connection with an investment, which could subject us to unknown liabilities.
In connection with strategic investments, acquisitions or entry into joint ventures, we conduct due diligence that we deem reasonable and appropriate based on the facts and circumstances applicable to such investments, acquisitions or joint ventures and expect to use our resources and oversight to enhance the risk management functions and diligence of our business and any investments going forward. When conducting due diligence, we have been required and will be required to evaluate important and complex business, financial, tax, accounting and legal issues. Outside consultants, legal advisers, accountants and investment banks may be involved in the due diligence process in the future in varying degrees depending on the type of investment. When conducting due diligence and making an assessment regarding a strategic investment, acquisition or joint venture, we have and will continue to rely on the resources available to us, including information provided by the target of the strategic investment, acquisition or joint venture, in some circumstances, third-party investigations. The due diligence investigations that we have carried out or will carry out with respect to any strategic investment, acquisition or joint venture may not reveal or highlight all relevant facts that may be necessary or helpful in evaluating the strategic investment, acquisition or joint venture, which could subject us to unknown liabilities that could adversely affect our profitability, financial condition and results of operations. Moreover, such investigations will not necessarily result in the strategic investment, acquisition or joint venture being successful.
Risk Related Generally to our Business
Our failure to comply with investment guidelines set by our clients and limitations imposed by applicable law could result in damage awards against us and a loss of our assets under management, either of which could adversely affect our results of operations or financial condition.
Certain clients who retain us to manage assets on their behalf specify guidelines regarding investment allocation and strategy that we are required to follow in managing their portfolios. In addition, the boards of mutual funds we sub-advise generally establish similar guidelines regarding the investment of assets in those funds. We are also required to invest the mutual funds’ assets in accordance with limitations under the Investment Company Act, and applicable provisions of the Internal Revenue Code of 1986, as amended, or the Internal Revenue Code. Our failure to comply with any of these guidelines and other limitations could result in losses to clients which, depending on the circumstances, could result in our obligation to make clients whole for such losses. If we believed that the circumstances did not justify a reimbursement, or clients believed the reimbursement we offered was insufficient, they could seek to recover damages from us, withdraw assets from our management or terminate their investment advisory agreement with us. Any of these events could harm our reputation and adversely affect our business.
Operational risks, including the threat of cyber attacks, may disrupt our business, breach our clients’ security, result in losses or limit our growth.
We are heavily dependent on the capacity and reliability of the communications, information and technology systems supporting our operations, whether developed, owned and operated by us or by third parties. Operational risks, such as trading or operational errors or interruption of our financial, accounting, trading, compliance and other data processing systems, whether caused by the failure to prevent or mitigate data loss or other security breaches, or other cyber security threats or attacks, including breaches of our vendors’ technology and systems, fire or other natural disaster, power or telecommunications failure, act of terrorism or war or otherwise, could result in a disruption of our business, liability to clients, regulatory intervention or reputational damage, and thus have a material adverse effect on our business. Some types of operational risks, including, for example, trading errors, may be
23
increased in periods of increased volatility, which can magnify the cost of an error. Cyber security risks relating to our business primarily involve the potential security breaches of our clients’ personal and financial information and illegal use thereof through system-wide “hacking” or other means. While we have never had any cyber security threat or attack on our technology systems, this may occur in the future.
Although we have back-up systems and cyber security and consumer protection measures in place, our back-up procedures, cyber defenses and capabilities in the event of a failure, interruption, or breach of security may not be adequate. Insurance and other safeguards we use may not be available or may only partially reimburse us for our losses related to operational failures or cyber attacks. In addition, we may choose to reimburse a client in the event of a trading error or under other circumstances, even if we are not legally required to do so, and any such reimbursements could adversely affect our results of operations.
As a public company and as our client base, number of investment strategies and/or physical locations increase, developing and maintaining our operational systems and infrastructure and protecting our systems from cyber security attacks and threats may become increasingly challenging and costly, which could constrain our ability to expand our businesses. Any upgrades or expansions to our operations and/or technology to accommodate increased volumes of transactions or otherwise may require significant expenditures and may increase the probability that we will suffer system interruptions and failures. We also depend substantially on our New York office where a majority of our employees, administration and technology resources are located, for the continued operation of our business. Any significant disruption to that office could have a material adverse effect on us.
Improper disclosure of personal data could result in liability and harm our reputation.
We and our service providers store and process personal client information. It is possible that the security controls, training and other processes with respect to personal data may not prevent the improper disclosure of client information. Such disclosure could harm our reputation as well and subject us to liability, resulting in increased costs or loss of revenue.
Employee misconduct could expose us to significant legal liability and reputational harm.
We are vulnerable to reputational harm because we operate in an industry in which personal relationships, integrity and the confidence of our clients are of critical importance. Our employees could engage in misconduct that adversely affects our business. For example, if an employee were to engage in illegal or suspicious activities, we could be subject to regulatory sanctions and suffer serious harm to our reputation (as a consequence of the negative perception resulting from such activities), financial position, client relationships and ability to attract new clients.
Our business often requires that we deal with confidential information. If our employees were to improperly use or disclose this information, even if inadvertently, we could be subject to legal action and suffer serious harm to our reputation, financial position and current and future business relationships. It is not always possible to deter employee misconduct, and the precautions we take to detect and prevent this activity may not always be effective. In addition, the SEC has increased its scrutiny of the use of non-public information obtained from corporate insiders by professional investors. Misconduct by our employees, or even unsubstantiated allegations of misconduct, could result in an adverse effect on our reputation and our business.
Failure to properly address conflicts of interest could harm our reputation, business and results of operations.
As we expand the scope of our business and our client base, we must continue to monitor and address any conflicts between our interests and those of our clients. The SEC and other regulators have increased their scrutiny of potential conflicts of interest, and we have implemented procedures and controls that we believe are reasonably designed to address these issues. However, appropriately dealing with conflicts of interest is complex, and if we fail, or appear to fail, to deal appropriately with conflicts of interest, we could face reputational damage, litigation or regulatory proceedings or penalties, any of which may adversely affect our results of operations.
We provide a broad range of services to Silvercrest Funds and family office services, which may expose us to liability.
We provide a broad range of administrative services to the management of certain of our company’s funds of funds and other investment funds, or collectively, the Silvercrest Funds, including preparation or supervision of the preparation of some of the Silvercrest Funds’ regulatory filings, provision of shareholder services and communications, accounting services including the supervision of the activities of Silvercrest Funds’ accounting services providers in the calculation of the funds’ net asset values, supervision of the preparation of Silvercrest Funds’ financial statements and coordination of the audits of those financial statements, tax services, including supervision of tax return preparation and supervision of the work of Silvercrest Funds’ other service providers. If it were determined that the Silvercrest Funds failed to comply with applicable regulatory requirements as a result of action or failure to act by our employees, we could be responsible for losses suffered or penalties imposed.
24
We also provide a range of family office services, in addition to investment management services, to some of our clients, including philanthropic, estate and wealth planning services, tax planning and preparation, financial statement, bill paying and record keeping services, bank loan arrangement and payment services and property and casualty insurance review. If we fail to perform these services properly, we could incur costs and reputational harm for which we might be liable. Further, we could have penalties imposed on us, be required to pay fines or be subject to private litigation, any of which could decrease our future income, or negatively affect our current business or our future growth prospects.
The investment management industry faces substantial litigation risks which could have a material adverse effect on our business, financial condition or results of operations or cause significant reputational harm to us.
We depend to a large extent on our network of relationships and on our reputation in order to attract and retain client assets. We make investment decisions on behalf of our clients that could result in substantial losses to them. If our clients suffer significant losses, or are otherwise dissatisfied with our services, we could be subject to the risk of legal liabilities or actions alleging negligent misconduct, breach of fiduciary duty, breach of contract, unjust enrichment and/or fraud. These risks are often difficult to assess or quantify and their existence and magnitude often remain unknown for substantial periods of time, even after an action has been commenced. We may incur significant legal expenses in defending against litigation commenced by a client or regulatory authority. Substantial legal liability or significant regulatory action against us could have a material adverse effect on our business, financial condition or results of operations or cause significant reputational harm to us.
The investment management industry is intensely competitive.
The investment management industry is intensely competitive, with competition based on a variety of factors, including investment performance, investment management fee rates, continuity of investment professionals and client relationships, the quality of services provided to clients, reputation, continuity of selling arrangements with intermediaries and differentiated products. A number of factors, including the following, serve to increase our competitive risks:
· | a number of our competitors have greater financial, technical, marketing and other resources, more comprehensive name recognition and more personnel than we do; |
· | potential competitors have a relatively low cost of entering the investment management industry; |
· | the recent trend toward consolidation in the investment management industry and the securities business in general, has served to increase the size and strength of a number of our competitors; |
· | some investors may prefer to invest with an investment manager that is not publicly traded based on the perception that a publicly traded asset manager may focus on the manager’s own growth to the detriment of investment performance for clients; |
· | some competitors may invest according to different investment styles or in alternative asset classes that the markets may perceive as more attractive than the investment strategies we offer; |
· | other industry participants, hedge funds and alternative asset managers may seek to recruit our investment professionals; and |
· | some competitors charge lower fees for their investment services than we do. |
If we are unable to compete effectively, our results of operations may be materially adversely affected.
Reductions in business sourced through third-party distribution channels, or their poor reviews of us or our products, could materially reduce our revenue and ability to attract new clients.
New accounts sourced through consultant-led searches may be a major component of our future growth. We also have accessed the high-net-worth segment of the investing community through relationships with well-respected wealth advisers who use our investment strategies in investment programs they construct for their clients. As of December 31, 2013 we had approximately $1.4 billion in assets under management from third party distribution channels, which constituted approximately 9.0% of our total assets under management. If we fail to successfully maintain these third-party distribution channels, our business could be materially adversely affected. In addition, many of these parties review and evaluate our products and our organization. Poor reviews or evaluations of either the particular product or of us may result in client withdrawals or may impact our ability to attract new assets through such intermediaries.
25
The significant growth we have experienced may be difficult to sustain.
Our assets under management have increased from $7.8 billion as of December 31, 2006 to $15.7 billion as of December 31, 2013. The absolute measure of our assets under management represents a significant rate of growth that may be difficult to sustain. The growth of our business will depend on, among other things, our ability to retain key investment professionals, to devote sufficient resources to maintaining existing investment strategies and to selectively develop new investment strategies. Our business growth also will depend on our success in achieving superior investment performance from our investment strategies, as well as our ability to maintain and extend our distribution capabilities, to deal with changing market conditions, to maintain adequate financial and business controls and to comply with new legal and regulatory requirements arising in response to both the increased sophistication of the investment management industry and the significant market and economic events of the last few years. If we believe that in order to continue to produce attractive returns from some or all of our investment strategies we should limit the growth of those strategies, we have in the past chosen, and in the future may choose, to limit or close access to those strategies to some or most categories of new investors or otherwise take action to slow the flow of assets into those strategies.
In addition, we expect there to be significant demand on our infrastructure and investment teams and we may not be able to manage our growing business effectively or be able to sustain the level of growth we have achieved historically, and any failure to do so could adversely affect our ability to generate revenue and control our expenses.
A change of control could result in termination of our sub-investment advisory and investment advisory agreements.
Pursuant to the Advisers Act, each of our investment advisory agreements for the separate accounts we manage may not be “assigned” without the consent of the client. In addition, under the Investment Company Act, each of the investment advisory agreements with SEC registered mutual funds that we sub-advise automatically terminates in the event of its assignment. A sale of a controlling block of our voting securities and certain other transactions would be deemed an “assignment” pursuant to the Advisers Act and the Investment Company Act. Such an assignment may be deemed to occur in the event that the holders of the Class B units of Silvercrest L.P. exchange enough of their Class B units for shares of our Class A common stock and dispose of such shares of Class A common stock such that they no longer own a controlling interest in us, even if no other person or group acquires a controlling interest. If such a deemed assignment occurs, there can be no assurance that we will be able to obtain the necessary consents from our clients and, unless the necessary approvals and consents are obtained, the deemed assignment could adversely affect our ability to continue managing client accounts, resulting in the loss of assets under management and a corresponding loss of revenue.
If our techniques for managing risk are ineffective, we may be exposed to material unanticipated losses.
In order to manage the significant risks inherent in our business, we must maintain effective policies, procedures and systems that enable us to identify, monitor and control our exposure to operational, legal and reputational risks. Our risk management methods may prove to be ineffective due to their design, implementation or insufficient scope, or as a result of the lack of adequate, accurate or timely information or otherwise. If our risk management efforts are ineffective, we could suffer losses that could have a material adverse effect on our financial condition or operating results. Additionally, we could be subject to litigation, particularly from our clients, and sanctions or fines from regulators or self-regulatory organizations. Our techniques for managing risks in client portfolios may not fully mitigate the risk exposure in all economic or market environments, or against all types of risk, including risks that we might fail to identify or anticipate.
Our reliance on prime brokers, custodians, administrators and other agents subjects us to certain risks relating to their execution of transactions and their solvency, and the failure by or insolvency of, any such person could adversely affect our business and financial performance.
Our business generally depends on the services of prime brokers, custodians, administrators and other agents to carry out securities transactions. For example, in the event of the insolvency of a prime broker and/or custodian, our funds might not be able to recover equivalent assets in full as they will rank among the prime broker’s and custodian’s unsecured creditors in relation to assets which the prime broker or a custodian borrows, lends or otherwise uses. In addition, our funds’ cash held with a prime broker or a custodian will not be segregated from the prime broker’s or custodian’s own cash, and our funds will therefore rank as unsecured creditors in relation thereto.
26
If we incur indebtedness or issue senior equity securities, we will be exposed to additional risks, including the typical risks associated with leverage.
The amount of leverage that we employ will depend on our board of directors’ assessment of market and other factors at the time of any proposed borrowing. We may also use leverage to make certain investments. There is no assurance that a leveraging strategy will be successful. Leverage involves risks and special considerations that include the following:
· | there is a likelihood of greater volatility of net asset value of our business and market price of our common stock than a comparable business without leverage; |
· | we will be exposed to increased risk of loss if we incur debt or issue senior equity securities to finance acquisitions or investments because a decrease in the value of our investments would have a greater negative impact on our returns, and therefore the value of our Class A common stock than if we did not use leverage; |
· | it is likely that such debt or equity securities will be governed by instruments containing covenants restricting our operating flexibility. These covenants may impose asset overage or investment composition requirements that are more stringent than those of our business plan and could require our business to liquidate investments at an inopportune time; |
· | if we are required to pledge a substantial portion of our assets in order to obtain debt financing, it may limit our ability to enter into subsequent financings at attractive terms; |
· | we, and indirectly our investors, will bear the cost of leverage, including issuance and servicing costs; and |
· | any preferred, convertible or exchangeable securities that we issue may have rights, preferences and privileges more favorable than those of our common stock. |
In addition, the credit facility entered into in June 2013, as explained below, by all of the subsidiaries of Silvercrest L.P. and guaranteed by Silvercrest L.P. contains financial and other restrictive covenants, including restrictions on distributions, incurrence of additional indebtedness, mergers and certain other dispositions of our business and sale of assets.
Any requirement that we sell assets at a loss to redeem or pay interest on any leverage or for other reasons would reduce our equity value and also make it difficult for our net asset value to recover. Our board of directors, in its best judgment, nevertheless may determine to use leverage if it expects that the benefits to our common stockholders of maintaining the leveraged position will outweigh the risks. General interest rate fluctuations may have a substantial negative impact on our investments and investment opportunities. In addition, an increase in interest rates would make it more expensive for us to use debt to finance these investments.
Future financings could adversely affect us and our common stockholders by diluting existing stockholders or by placing restrictions on our ability to run our business, including making distributions to unitholders.
The subsidiaries of Silvercrest L.P. entered into a credit facility in June 2013, pursuant to which the subsidiaries of Silvercrest L.P. will be able to borrow up to $15.0 million in principal amount from time to time for working capital needs and other purposes. Although we believe that available borrowings under our new credit facility and future cash flow from operations will be sufficient to meet our working capital requirements for normal operations pursuant to our business plan, these sources of capital may not fully fund our growth strategy in the immediate future. If we decide to pursue future acquisitions, we may draw down proceeds from our existing credit facilities and then raise additional capital through the incurrence of long-term or short-term indebtedness or the issuance of additional equity securities in private or public transactions. This could result in dilution of existing common stockholders’ equity positions, increased interest expense and decreased net income. In addition, significant capital requirements associated with such investments may impair our ability to make distributions to our Class A common stockholders.
Risks Related to Our Structure
The rights of holders of Class B units of Silvercrest L.P. may give rise to conflicts of interest.
As a result of our principals holding all or a portion of their ownership interests in our business through Silvercrest L.P., rather than through Silvercrest, these existing owners may have other conflicting interests with holders of our Class A common stock. For example, our principals may have different tax positions from holders of our Class A common stock which could influence their decisions regarding whether and when we should dispose of assets, whether and when we should incur new or refinance existing indebtedness, especially in light of the existence of the tax receivable agreement that was entered into in connection with our initial public offering, and whether and when our company should terminate the tax receivable agreement and accelerate its obligations thereunder. Also, the structuring of future transactions may take into consideration principals’ tax or other considerations even where no similar benefit would accrue to us.
27
Our ability to pay regular dividends to our stockholders is subject to the discretion of our board of directors and may be limited by our structure and applicable provisions of Delaware law.
We intend to declare cash dividends on our Class A common stock. However, our board of directors may, in its sole discretion, change the amount or frequency of dividends or discontinue the payment of dividends entirely. In addition, because of our structure, we will be dependent upon the ability of our subsidiaries to generate earnings and cash flows and distribute them to us so that we may pay dividends to our stockholders. We expect to cause Silvercrest L.P., which is a Delaware limited partnership, to make distributions to its partners, including us, in an amount sufficient for us to pay dividends. However, its ability to make such distributions will be subject to its subsidiaries’ operating results, cash requirements and financial condition, the applicable provisions of Delaware law that may limit the amount of funds available for distribution to its partners, its compliance with covenants and financial ratios related to current and future indebtedness (including the credit facility entered into in June 2013 by the subsidiaries of Silvercrest L.P.), its other agreements with third parties, as well as its obligation to make tax distributions under the second amended and restated limited partnership agreement (which distributions would reduce the cash available for distributions by Silvercrest L.P. to us). As a Delaware corporation, our ability to pay cash dividends to our Class A common stockholders with the distributions received by us as general partner of Silvercrest L.P. also will be subject to the applicable provisions of Delaware law. Also, each of the companies in the corporate chain must manage its assets, liabilities and working capital in order to meet all of its cash obligations, including the payment of dividends or distributions. As a consequence of these various limitations and restrictions, we may not be able to make, or may have to reduce or eliminate, the payment of dividends on our Class A common stock. Any change in the level of our dividends or the suspension of the payment thereof could adversely affect the market price of our Class A common stock.
Our ability to pay taxes and expenses, including payments under the tax receivable agreement, may be limited by our structure.
We have no material assets other than our ownership of Class A units of Silvercrest L.P. and have no independent means of generating revenue. Silvercrest L.P. is treated as a partnership for U.S. federal income tax purposes and, as such, is not subject to U.S. federal income tax. Instead, taxable income is allocated to holders of its partnership units, including us. Accordingly, we will incur income taxes on our proportionate share of any net taxable income of Silvercrest L.P. and also will incur expenses related to our operations. Under the terms of its second amended and restated limited partnership agreement, Silvercrest L.P. is obligated to make tax distributions to holders of its partnership units, including us. In addition to tax expenses, we also will incur expenses related to our operations, including expenses under the tax receivable agreement, which we expect will be significant. We intend to cause Silvercrest L.P. to make distributions in an amount sufficient to allow us to pay our taxes and operating expenses, including any payments due under the tax receivable agreement. However, its ability to make such distributions will be subject to various limitations and restrictions as set forth in the preceding risk factor. If, as a consequence of these various limitations and restrictions, we do not have sufficient funds to pay tax or other liabilities to fund our operations, we may need to borrow funds and thus this could have a material adverse effect on our liquidity and financial condition. To the extent we are unable to make payments under the tax receivable agreement for any reason, such payments will be deferred and will accrue interest at LIBOR plus 300 basis points until paid.
We will be required to pay principals for certain tax benefits we may claim, and the amounts we may pay could be significant.
The corporate reorganization of Silvercrest L.P. resulted in favorable tax attributes for us. In addition, future exchanges of Class B units of Silvercrest L.P. held by our principals for shares of our Class A common stock are expected to produce additional favorable tax attributes for us. When we acquire Class B units from existing principals, both the existing basis and the anticipated basis adjustments are likely to increase (for tax purposes) depreciation and amortization deductions allocable to us from Silvercrest L.P. and therefore reduce the amount of income tax we would otherwise be required to pay in the future. This increase in tax basis also may decrease gain (or increase loss) on future dispositions of certain capital assets to the extent the increased tax basis is allocated to those capital assets.
The tax receivable agreement, which we entered into with our principals, generally provides for the payment by us to each of them of 85% of the amount of the cash savings, if any, in U.S. federal and state income tax that we actually realize (or are deemed to realize in certain circumstances) in periods after our initial public offering as a result of (i) any step-up in tax basis in Silvercrest L.P.’s assets resulting from (a) the purchases or exchanges of Class B units (along with the corresponding shares of our Class B common stock) for shares of our Class A common stock and (b) payments under this tax receivable agreement; (ii) certain prior distributions by Silvercrest L.P. and prior transfers or exchanges of Class B units which resulted in tax basis adjustments to the assets of Silvercrest L.P.; and (iii) tax benefits related to imputed interest deemed to be paid by us as a result of this tax receivable agreement.
We expect that the payments we will be required to make under the tax receivable agreement will be substantial. Assuming no material changes in the relevant tax law and that we earn sufficient taxable income to realize all tax benefits that are subject to the tax receivable agreement, we expect that the reduction in tax payments for us associated with (i) the purchase of Class B units from certain of the limited partners of Silvercrest L.P. with a portion of the net proceeds of our initial public offering and (ii) future exchanges of Class B units as described above would aggregate approximately $18.0 million over a 15-year period and assuming all future exchanges or purchases, other than the purchases in connection with our initial public offering, would occur one year after our initial public offering. Under such scenario we would be required to pay the holders of Class B limited partnership units 85% of such
28
amount, or approximately $15.3 million, over a 15-year period. The actual amounts may materially differ from these hypothetical amounts, as potential future reductions in tax payments for us and tax receivable agreement payments by us will be calculated using the market value of our Class A common stock and the prevailing tax rates at the time of the exchange and will be dependent on us generating sufficient future taxable income to realize the benefit.
The actual increase in tax basis, as well as the amount and timing of any payments under this agreement, will vary depending upon a number of factors, including the timing of exchanges by principals, the price of our Class A common stock at the time of the exchange, the extent to which such exchanges are taxable, the amount and timing of the taxable income we generate in the future and the tax rate then applicable, as well as the portion of our payments under the tax receivable agreement constituting imputed interest or depreciable or amortizable basis. Payments under the tax receivable agreement will be based on the tax reporting positions that we determine. Although we are not aware of any issue that would cause the Internal Revenue Service, or the IRS, to challenge a tax basis increase or other tax attributes subject to the tax receivable agreement, we will not be reimbursed for any payments previously made under the tax receivable agreement. As a result, in certain circumstances, payments could be made under the tax receivable agreement in excess of the benefits that we actually realize in respect of the attributes to which the tax receivable agreement relates.
In certain cases, payments under the tax receivable agreement to our principals may be accelerated and/or significantly exceed the actual benefits we realize in respect of the tax attributes subject to the tax receivable agreement.
The tax receivable agreement provides that upon certain mergers, asset sales, other forms of business combinations or other changes of control, or if, at any time, we elect an early termination of the tax receivable agreement, our (or our successor’s) obligations under the tax receivable agreement (with respect to all Class B units held by our principals, whether or not such Class B units have been exchanged or acquired before or after such transaction) would be based on certain assumptions, including that we would have sufficient taxable income to fully avail ourselves of the deductions arising from the increased tax deductions and tax basis and other benefits related to entering into the tax receivable agreement. As a result, (i) we could be required to make payments under the tax receivable agreement that are greater than or less than the specified percentage of the actual benefits we realize in respect of the tax attributes subject to the tax receivable agreement, and (ii) if we elect to terminate the tax receivable agreement early, we would be required to make an immediate payment equal to the present value of the anticipated future tax benefits, which payment may be made significantly in advance of the actual realization of such future benefits. In these situations, our obligations under the tax receivable agreement could have a substantial negative impact on our liquidity and could have the effect of delaying, deferring or preventing certain mergers, asset sales, other forms of business combinations or other changes of control. There can be no assurance that we will be able to finance our obligations under the tax receivable agreement. If we were to elect to terminate the tax receivable agreement, we estimate that we would be required to pay approximately $15.3 million in the aggregate under the tax receivable agreement.
If we were deemed an investment company under the Investment Company Act as a result of our ownership interest in Silvercrest L.P., applicable restrictions could make it impractical for us to continue our business as contemplated and could have a material adverse effect on our business.
We do not believe that we are an “investment company” under the Investment Company Act. Because we, as the sole general partner of Silvercrest L.P., control and operate Silvercrest L.P., we believe that our interest in Silvercrest L.P. is not an “investment security” as that term is used in the Investment Company Act. If we were to cease participation in the management of Silvercrest L.P., our interest in Silvercrest L.P. could be deemed an “investment security” for purposes of the Investment Company Act. A person may be an “investment company” if it owns investment securities having a value exceeding 40% of the value of its total assets (exclusive of U.S. government securities and cash items). Our sole asset is our general partner interest in Silvercrest L.P. A determination that such investment was an investment security could cause us to be deemed an investment company under the Investment Company Act and to become subject to the registration and other requirements of the Investment Company Act. In addition, we do not believe that we are an investment company under Section 3(b)(1) of the Investment Company Act because we are not primarily engaged in a business that causes us to fall within the definition of “investment company.” We and Silvercrest L.P. intend to conduct our operations so that we will not be deemed an investment company. However, if we were to be deemed an investment company, restrictions imposed by the Investment Company Act, including limitations on our capital structure and our ability to transact with affiliates, could make it impractical for us to continue our business as contemplated and could have a material adverse effect on our business.
Risks Related to our Common Stock
The market price and trading volume of our Class A common stock may be volatile, which could result in rapid and substantial losses for our stockholders.
The market price of our Class A common stock may be highly volatile and could be subject to wide fluctuations. Moreover, the trading volume of our Class A common stock may fluctuate and cause significant price variations to occur. If the market price of our Class A common stock declines significantly, you may be unable to sell your shares of Class A common stock at or above the price at which you purchased it, if at all. The market price of our Class A common stock may fluctuate or decline significantly in the future.
29
Some of the factors that could negatively affect the price of our Class A common stock, or result in fluctuations in the price or trading volume of our Class A common stock, include:
· | variations in our quarterly or annual operating results; |
· | failure to meet the market’s earnings expectations; |
· | publication of research reports about us or the investment management industry, or the failure of securities analysts to continue to cover our Class A common stock; |
· | the public’s reactions to our press releases, other public announcements and filings with the SEC; |
· | departures of any of our portfolio managers or members of our senior management team or additions or departures of other key personnel; |
· | adverse market reaction to any indebtedness we may incur or securities we may issue in the future; |
· | market and industry perception of our success, or lack thereof, in pursuing our growth strategies; |
· | actions by stockholders; |
· | strategic actions by us or our competitors such as acquisitions or restructurings; |
· | changes in market valuations of similar companies; |
· | changes in our capital structure; |
· | actual or anticipated poor performance in one or more of the investment strategies we offer; |
· | changes or proposed changes in laws or regulations, or differing interpretations thereof, affecting our business, or enforcement of these laws and regulations, or announcements relating to these matters; |
· | changes in accounting standards, policies, guidance, interpretations or principles; |
· | adverse publicity about the investment management industry generally or as a result of specific events; |
· | sales of shares of our Class A common stock by us or members of our management team; |
· | litigation and governmental investigations; |
· | the expiration of contractual lockup agreements; and |
· | changes in general market, economic and political conditions in the United States and global economies or financial markets, including those resulting from natural disasters, terrorist attacks, acts of war, and responses to such. |
Future issuances and sales of our Class A common stock in the public market could lower our stock price, and any additional capital raised by us through the sale of equity or convertible securities may dilute your ownership in us.
The market price of our Class A common stock could decline as a result of sales of a large number of shares of our Class A common stock available for sale, or the perception that such sales could occur. These sales, or the possibility that these sales may occur, also may make it more difficult for us to raise additional capital by selling equity securities in the future, at a time and price that we deem appropriate.
30
We have 7,522,974 shares of our Class A common stock outstanding as of March 18, 2014. The shares of Class A common stock that will be issuable upon exchange of Class B units held by our principals may only be sold in the manner at the times described in our exchange agreement with our principals. For so long as a principal remains employed by us, during every 12-month period, each principal and his permitted transferees (e.g., family trusts) may collectively exchange vested Class B units that equal 20% of the Class B units such persons collectively held at the beginning of such 12-month period, subject to certain exceptions described under the second amended and restated limited partnership agreement of Silvercrest L.P. Upon a termination of employment other than due to retirement or for cause, all Class B units held by a principal, other than those Class B units forfeited under certain circumstances, will be exchanged automatically for shares of Class A common stock. The shares of Class A common stock received upon exchange for Class B units held by our principals may be sold (i) at any time and in any manner by retired employees and employees or estates of employees terminated due to death or disability, (ii) for any principal whose employment is terminated by us without cause, in an amount equal to 50% of the total shares of Class A common stock held by the principal at the time of termination of employment less any amounts sold for taxes in each 12-month period following the 18-month anniversary of the date of termination of employment, and (iii) for any principal who voluntarily resigns his employment, in an amount equal to one-third of the total shares of Class A common stock held by the principal at the time of termination of employment less any amounts sold for taxes in each 12-month period following the 18-month anniversary of the date of resignation of employment subject to manner of sale restrictions. The estate of our former Chief Executive Officer may sell portions or all of its Class A common shares in Silvercrest in order to diversify its portfolio.
As of December 31, 2013 we have reserved for issuance 1,670,960 shares of our Class A common stock pursuant to, upon the exercise of options or other equity awards granted under, or upon exchange of Class B units granted under, our 2012 Equity Incentive Plan. We may increase the number of shares registered for this purpose from time to time. Once we register these additional shares, they will be able to be sold in the public market upon issuance.
We cannot predict the size of future issuances of our Class A common stock or the effect, if any, that future issuances and sales of shares of our Class A common stock may have on the market price of our Class A common stock. Sales or distributions of substantial amounts of our Class A common stock (including shares issued in connection with an acquisition), or the perception that such sales could occur, may cause the market price of our Class A common stock to decline.
We are an “emerging growth company,” and any decision on our part to comply only with certain reduced disclosure requirements applicable to emerging growth companies could make our Class A common stock less attractive to investors.
We are an “emerging growth company,” as defined in the Jumpstart Our Business Startups Act, or the JOBS Act, enacted in April 2012, and, for as long as we continue to be an “emerging growth company,” we may choose to take advantage of exemptions from various reporting requirements applicable to other public companies but not to “emerging growth companies,” including, but not limited to, not being required to comply with the auditor attestation requirements of Section 404 of Sarbanes-Oxley, reduced disclosure obligations regarding executive compensation in our periodic reports and proxy statements, and exemptions from the requirements of holding a nonbinding advisory vote on executive compensation and shareholder approval of any golden parachute payments not previously approved. We could remain an “emerging growth company” for up to five years, or until the earliest of (i) the last day of the first fiscal year in which our annual gross revenues exceed $1 billion, (ii) the date that we become a “large accelerated filer” as defined in Rule 12b-2 under the Exchange Act, which would occur if the market value of our Class A common stock that is held by non-affiliates exceeds $700 million as of the last business day of an issuer’s most recently completed second fiscal quarter before the end of that five-year period, or (iii) the date on which we have issued more than $1 billion in nonconvertible debt during the preceding three-year period. We cannot predict whether investors will find our Class A common stock less attractive if we choose to rely on these exemptions. If some investors find our Class A common stock less attractive as a result of any decisions to reduce future disclosure, there may be a less active trading market for our Class A common stock and our stock price may be more volatile.
In addition, Section 107 of the JOBS Act also provides that an “emerging growth company” can take advantage of the extended transition period provided in Section 7(a)(2)(B) of the Securities Act for complying with new or revised accounting standards. In other words, an “emerging growth company” can delay the adoption of certain accounting standards until those standards would otherwise apply to private companies. We chose, however, to “opt out” of such extended transition period, and as a result, we will comply with new or revised accounting standards on the relevant dates on which adoption of such standards is required for non-emerging growth companies. Section 107 of the JOBS Act provides that our decision to opt out of the extended transition period for complying with new or revised accounting standards is irrevocable.
The requirements of being a public company may strain our resources and distract our management, which could make it difficult to manage our business, particularly after we are no longer an “emerging growth company.”
As a public company, we are required to comply with various regulatory and reporting requirements, including those required by the SEC. Complying with these reporting and other regulatory requirements is time-consuming and results in increased costs to us and could have a negative effect on our business, results of operations and financial condition. As a public company, we are subject to the reporting requirements of the Exchange Act and requirements of Sarbanes Oxley. These requirements may place a strain on our systems and resources. The Exchange Act requires that we file annual, quarterly and current reports with respect to our business and financial condition. Sarbanes Oxley requires that we maintain effective disclosure controls and procedures and internal controls over
31
financial reporting. To maintain and improve the effectiveness of our disclosure controls and procedures, we need to commit significant resources, hire additional staff and provide additional management oversight. We have implemented additional procedures and processes for the purpose of addressing the standards and requirements applicable to public companies. We are also considering an upgrade to our financial reporting systems. Sustaining our growth also will require us to commit additional management, operational and financial resources to identify new professionals to join our company and to maintain appropriate operational and financial systems to adequately support expansion. In addition, as a public company, we have enhanced our investor relations, legal and corporate communications functions. All of these activities and additional efforts may increase our costs, strain our resources and divert management’s attention from other business concerns, which could have a material adverse effect on our business, financial condition, results of operations and cash flows.
As an “emerging growth company” as defined in the JOBS Act, we will take advantage of certain temporary exemptions from various reporting requirements including, but not limited to, not being required to comply with the auditor attestation requirements of Section 404 of Sarbanes Oxley (and rules and regulations of the SEC thereunder, which we refer to as Section 404) and reduced disclosure obligations regarding executive compensation in our periodic reports and proxy statements. When these exemptions cease to apply, we expect to incur additional expenses and devote increased management effort toward ensuring compliance with them. We cannot predict or estimate the amount of additional costs we may incur as a result of becoming a public company or the timing of such costs.
You may experience dilution in the future.
You will experience further dilution upon the issuance of restricted Class B units or restricted shares of our Class A common stock, or upon the grant of options or other equity awards to purchase Class B units or shares of our Class A common stock, in each case under our 2012 Equity Incentive Plan.
We have broad discretion in the use of the net proceeds to us from our initial public offering and may not use them in a manner in which our stockholders would consider appropriate.
We cannot specify with certainty the particular uses of the net proceeds remaining after the repurchase of Class B units from existing limited partners that we received from our initial public offering. Our management will have broad discretion in the application of the net proceeds. Our stockholders may not agree with the manner in which our management chooses to allocate and spend the net proceeds. The failure by our management to apply these funds effectively could have an adverse effect on our business. Pending their use, we may invest the net proceeds from our initial public offering in a manner that does not produce income or that loses value.
Anti-takeover provisions in our second amended and restated certificate of incorporation and amended and restated bylaws could discourage a change of control that our stockholders may favor, which also could adversely affect the market price of our Class A common stock.
Provisions in our second amended and restated certificate of incorporation and amended and restated bylaws may make it more difficult and expensive for a third party to acquire control of us, even if a change of control would be beneficial to our stockholders. For example, our second amended and restated certificate of incorporation authorizes our board of directors to issue up to 10,000,000 shares of our preferred stock and to designate the rights, preferences, privileges and restrictions of unissued series of our preferred stock, each without any vote or action by our stockholders. We could issue a series of preferred stock to impede the consummation of a merger, tender offer or other takeover attempt. In addition, our second amended and restated certificate of incorporation will provide that our board of directors is classified into three classes of directors. The anti-takeover provisions in our second amended and restated certificate of incorporation and bylaws may impede takeover attempts, or other transactions, that may be in the best interests of our stockholders and, in particular, our Class A stockholders.
For example, our stockholders are unable to take any action by written consent, call a special meeting or require our board to call a special meeting, each of which impedes stockholders’ ability to take certain actions related to takeovers. In addition, the advance notice requirements in our amended and restated bylaws hinder a stockholder’s ability to bring matters before the board, in particular matters relating to a change in control, due to the 90-day notice period required before any action may be requested in some circumstances.
Our second amended and restated certificate of incorporation and amended and restated bylaws also grant the board the power to increase the authorized number of directors without stockholder consent, by resolution adopted by the affirmative vote of a majority of the entire board, thus preventing a stockholder from being able to control the board and its decisions. Similarly, the board has the sole ability to fill newly created directorships. Further, while any director or the whole board may only be removed for cause by the vote of the holders of a majority of the shares of common stock and preferred stock, there is no power of stockholders to remove a director without cause. Our board also has the power to adopt, amend or repeal the bylaws, subject only to such limitation, if any, as may from time to time be imposed by law or by the bylaws, while stockholder action to adopt, amend or repeal the bylaws requires a
32
vote of 66 2/3% of the outstanding common stock. Many of these provisions could hinder stockholders’ ability to consummate certain transactions that may benefit our business and the price of our common stock.
Moreover, the market price of our Class A common stock could be adversely affected to the extent that provisions of our second amended and restated certificate of incorporation and amended and restated bylaws discourage potential takeover attempts, or other transactions, that our stockholders may favor.
If securities or industry analysts do not publish research or publish inaccurate or unfavorable research about our business, our stock price and trading volume could decline.
The trading market for our Class A common stock depends in part on the research and reports that securities or industry analysts publish about us or our business. If one or more of the analysts who covers us downgrades our stock or publishes inaccurate or unfavorable research about our business, our stock price would likely decline. If one or more of these analysts ceases coverage of us or fails to publish reports on us regularly, demand for our stock could decrease, which could cause our stock price and trading volume to decline.
Our corporate headquarters are located at 1330 Avenue of the Americas, 38th Floor, New York, New York 10019, where we occupy approximately 41,000 square feet of space under a lease, the terms of which expire on September 30, 2017. We also lease space for our other three offices. We believe our current facilities are adequate for our current needs and that suitable additional space will be available as and when needed.
In the normal course of business, we may be subject to various legal and administrative proceedings. Currently, there are no legal proceedings pending or threatened against us.
33
Item 5. Market for Registrant’s Common Equity, Related Stockholder Matters and Issuer Purchases of Equity Securities
Our Class A common stock is listed and trading on The Nasdaq Global Market under the symbol “SAMG” since June 27, 2013. Prior to June 27, 2013, there was no established public trading market for our Class A common stock. Our Class B common stock is not listed on The Nasdaq Global Market and there is no established trading market for such shares.
The following table presents information on the high and low sales prices per share as reported on The Nasdaq Global Market for our Class A common stock for the periods indicated and dividends declared during such periods:
|
|
2013 |
|
|||||||||
|
|
High |
|
|
Low |
|
|
Dividends |
|
|||
Second Quarter (1) |
|
$ |
12.90 |
|
|
$ |
11.27 |
|
|
|
N/A |
|
Third Quarter |
|
$ |
15.52 |
|
|
$ |
11.25 |
|
|
|
N/A |
|
Fourth Quarter |
|
$ |
18.00 |
|
|
$ |
13.35 |
|
|
$ |
0.12 |
|
(1) | The period reported for the second quarter is from June 27, 2013 through June 30, 2013. |
No purchases of our Class A common stock were made by us or on our behalf during the quarter ended December 31, 2013.
Holders
As of March 18, 2014 there were 6 holders of record of our Class A common stock and 37 holders of record of our Class B common stock. A substantially greater number of holders of our Class A common stock are held in “street name” and held of record by banks, brokers, and other financial institutions.
Dividends
We pay and intend to continue paying quarterly cash dividends to the holders of our Class A common stock. Only holders of our Class A common stock will be entitled to any dividend declared by us on our capital stock. We are a holding company and have no material assets other than our ownership of the general partnership interest of Silvercrest L.P. As a result, we intend to fund any future dividends, from our portion of the distributions from Silvercrest L.P. If Silvercrest L.P. makes distributions to its partners, holders of Class B units will be entitled to receive equivalent distributions on a pro rata basis.
All of the foregoing is subject to the qualification that the declaration and payment of any distributions by Silvercrest L.P. are at our sole discretion, as general partner, and we may change our distribution policy at any time.
In addition, the declaration and payment of any dividends to our stockholders is at the sole discretion of our board of directors. Our board or directors may decide not to declare a dividend on our Class A common stock even if Silvercrest L.P. makes a distribution to its partners, including Silvercrest. In determining whether to make a dividend payment to our Class A stockholders, our board of directors will take into account:
· | our financial results as well as the financial results of Silvercrest L.P.; |
· | our available cash and anticipated cash needs; |
· | the capital requirements of our company and our direct and indirect subsidiaries (including Silvercrest L.P.); |
· | contractual, legal, tax and regulatory restrictions on, and implications of, the payment of dividends by us to our stockholders or by our direct and indirect subsidiaries (including Silvercrest L.P.) to us; |
· | general economic and business conditions; and |
· | such other factors as our board of directors may deem relevant. |
Other than our credit facility, which SAMG LLC entered into in June 2013, neither we nor any of our direct or indirect subsidiaries has any debt obligations that limit our or its ability to pay dividends or distributions. Our credit facility limits SAMG LLC’s ability to make distributions to the extent SLP and its subsidiaries are not in compliance with covenants and financial ratios related to such facility. However, pursuant to its second amended and restated limited partnership agreement, Silvercrest L.P. may not
34
make any distributions to its partners, including us, if doing so would violate any agreement to which it is then a party or any law then applicable to it, have the effect of rendering it insolvent or result in it having net capital lower than that required by applicable law.
Our dividend policy has certain risks and limitations, particularly with respect to liquidity. Although we expect to pay dividends according to our dividend policy, we may not pay dividends according to our policy, or at all, if, among other things, we do not have the cash necessary to pay our intended dividends. By paying cash dividends rather than saving or investing that cash, we risk, among other things, slowing the pace of our growth and having insufficient cash to fund our operations or unanticipated capital expenditures.
During 2013, we paid a dividend totaling $0.12 per share of Class A common stock or $0.7 million, and in February 2014, our board of directors declared a dividend of $0.12 per share or $0.9 million, to Class A common shareholders in respect of the fourth quarter of 2013 payable on March 20, 2014 to holders of record of Class A common stock at the close of business on March 7, 2014.
Recent Sales of Unregistered Securities
There were no sales of unregistered equity securities during the three months ended December 31, 2013.
Equity Compensation Plan Information
|
|
|
|
|
|
(c) |
|
|
|
|
|
|
|
Number of |
|
|
|
(a) |
|
|
|
securities remaining |
|
|
|
Number of |
|
|
|
available for future |
|
|
|
securities to be |
|
(b) |
|
issuance |
|
|
|
issued |
|
Weighted-average |
|
under equity |
|
|
|
upon exercise of |
|
exercise price of |
|
compensation plans |
|
|
|
outstanding |
|
outstanding |
|
(excluding |
|
|
|
options, warrants |
|
options, warrants |
|
securities reflected |
|
Plan Category |
|
and rights |
|
and rights |
|
in column (a)) |
|
Equity compensation plans approved by security holders |
|
– |
|
– |
|
16,70,960 |
|
Equity compensation plans not approved by security holders |
|
– |
|
– |
|
– |
|
Total |
|
– |
|
– |
|
16,70,960 |
|
In July 2013, we issued 16,540 shares of Class B common stock to one of the principals of Silvercrest L.P. in connection with the issuance of a like number of Class B units of Silvercrest LP to such employee-partner. The Class B units were issued pursuant to the 2012 Equity Incentive Plan. A total of 1,670,960 shares of Class A common stock were registered and remain reserved for issuance, respectively, under the 2012 Equity Incentive Plan as of December 31, 2013.
Performance Graph
The following graph compares the cumulative total stockholder return on our common stock from June 27, 2013 (the date our Class A common stock first began trading on The Nasdaq Global Market) through December 31, 2013, with the cumulative total return of the Standard & Poor’s 500 Stock Index and the SNL Asset Manager Index*. The SNL Manager Index is a composite of 35 publicly traded asset management companies prepared by SNL Financial, Charlottesville, Virginia. The graph assumes the investment of $100 in our Class A common stock and in each of the two indexes on June 26, 2013 and the reinvestment of all dividends, if any. The initial public offering price of our Class A common stock was $11.00 per share.
35
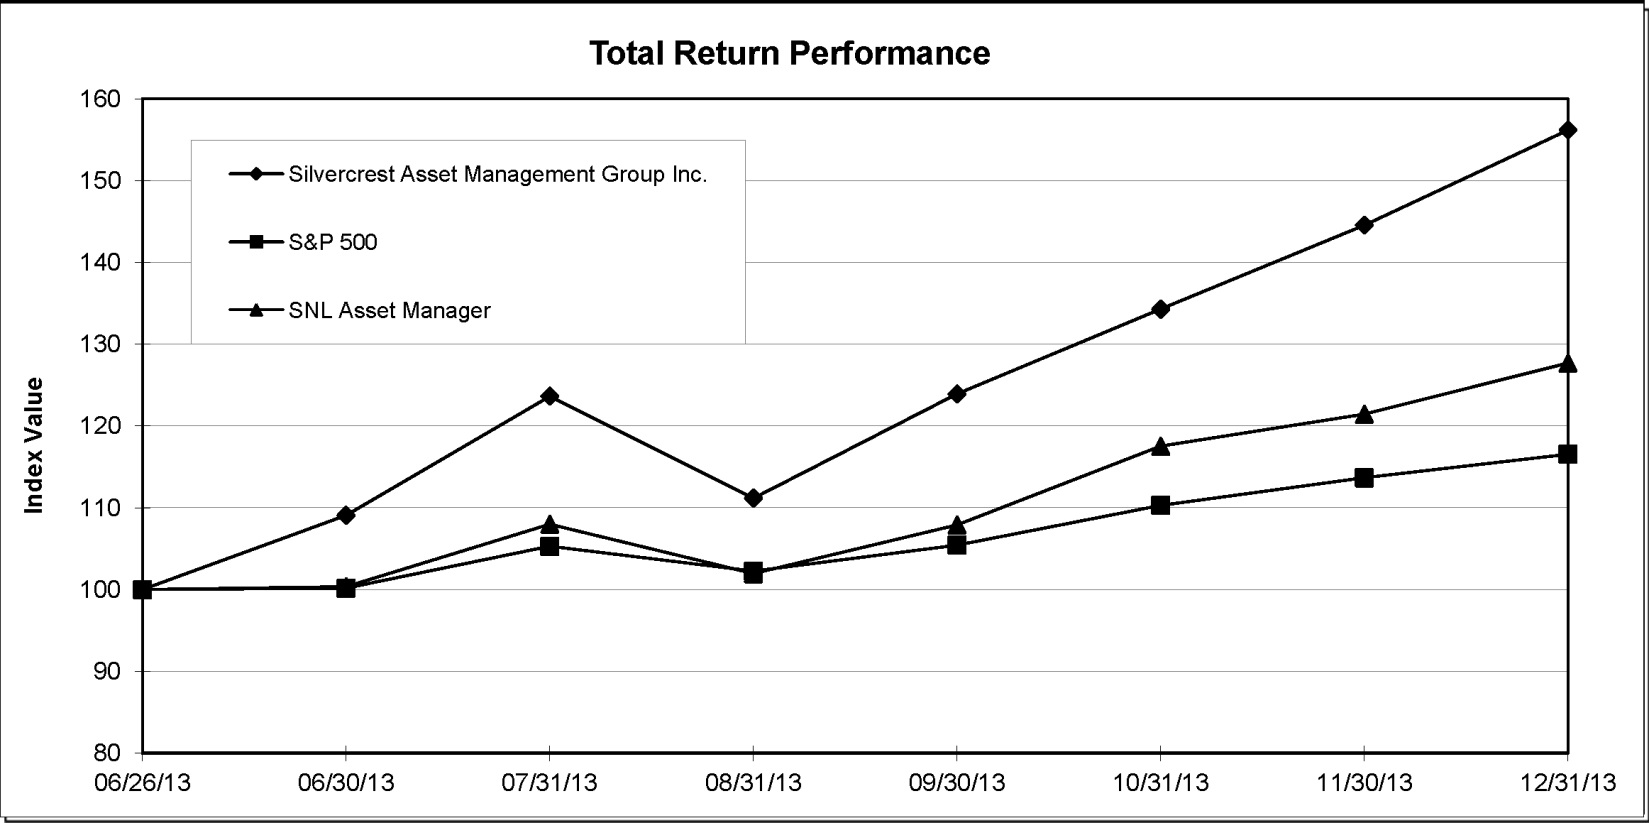
Index |
|
06/26/13 |
|
06/30/13 |
|
07/31/13 |
|
08/31/13 |
|
09/30/13 |
|
10/31/13 |
|
11/30/13 |
|
12/31/13 |
Silvercrest Asset Management Group Inc. |
|
100.00 |
|
109.09 |
|
123.64 |
|
111.18 |
|
123.91 |
|
134.27 |
|
144.55 |
|
156.17 |
S&P500 |
|
100.00 |
|
100.20 |
|
105.30 |
|
102.25 |
|
105.45 |
|
110.30 |
|
113.66 |
|
116.54 |
SNL Asset Manager |
|
100.00 |
|
100.35 |
|
108.01 |
|
101.94 |
|
107.92 |
|
117.52 |
|
121.46 |
|
127.71 |
*As of 12/31/2013, the SNL Asset Manager Index comprised the following companies: Affiliated Managers Group Inc.; AllianceBernstein Holding L.P.; Apollo Global Mgmt LLC; Artisan Partners Asset Mgmt.; BlackRock Inc.; Blackstone Group L.P.; Calamos Asset Mgmt Inc.; Carlyle Group L.P.; Cohen & Steers Inc.; Diamond Hill Investment Group; Eaton Vance Corp.; Federated Investors Inc.; Financial Engines Inc.; Fortress Investment Group LLC; Franklin Resources Inc.; GAMCO Investors Inc.; Hennessy Advisors Inc.; Invesco Ltd.; Janus Capital Group Inc.; KKR & Co. L.P.; Legg Mason Inc.; Manning & Napier; Oaktree Capital Group LLC; Och-Ziff Capital Mgmt Group; Pzena Investment Mgmt Inc.; Resource America Inc.; SEI Investments Co.; Silvercrest Asset Mgmt Group; T. Rowe Price Group Inc.; U.S. Global Investors Inc.; Value Line Inc.; Virtus Investment Partners; Waddell & Reed Financial Inc.; Westwood Holdings Group Inc.; WisdomTree Investments Inc.
In accordance with the rules of the SEC, this section entitled “Performance Graph” shall not be incorporated by reference into any future filings by us under the Securities Act or Exchange Act, and shall not be deemed to be soliciting material or to be filed under the Securities Act or the Exchange Act.
Item 6. Selected Financial Data.
The following tables set forth selected historical consolidated financial and other data of Silvercrest as of and for the year ended December 31, 2013. The consolidated statement of financial position data as of December 31, 2012, 2011, 2010 and 2009, the portion of the operating results included in the consolidated statement of operations data for the year ended December 31, 2013 that relates to the six months ended June 30, 2013, and the operating results included in the consolidated statement of operations data for the years ended 2012, 2011, 2010 and 2009 are those of Silvercrest L.P., our predecessor for accounting purposes. The consolidated statement of operations data for the year ended December 31, 2013 represents the combination of Silvercrest L.P.’s results of operations for the six months ended June 30, 2013 and Silvercrest’s results of operations for the six months ended December 31, 2013.
You should read the following selected historical consolidated financial data together with “Management’s Discussion and Analysis of Financial Condition and Results of Operations” and the consolidated financial statements and related notes included elsewhere in this report.
36
|
Years Ended December 31, |
||||||||||||||||||
|
|
2013 |
|
|
|
2012 |
|
|
|
2011 |
|
|
|
2010 |
|
|
|
2009 |
|
Statements of operations data: |
|
|
|
|
|
|
|
|
|
|
|
|
|
|
|
|
|
|
|
Revenue: |
|
|
|
|
|
|
|
|
|
|
|
|
|
|
|
|
|
|
|
Management and advisory fees |
$ |
53,465 |
|
|
$ |
46,069 |
|
|
$ |
37,869 |
|
|
$ |
32,442 |
|
|
$ |
29,341 |
|
Performance fees and allocations |
|
1,830 |
|
|
|
714 |
|
|
|
85 |
|
|
|
548 |
|
|
|
96 |
|
Family office services |
|
4,756 |
|
|
|
4,907 |
|
|
|
4,833 |
|
|
|
3,841 |
|
|
|
3,097 |
|
Total revenue |
|
60,051 |
|
|
|
51,690 |
|
|
|
42,787 |
|
|
|
36,831 |
|
|
|
32,534 |
|
Expenses: |
|
|
|
|
|
|
|
|
|
|
|
|
|
|
|
|
|
|
|
Compensation and benefits |
|
30,322 |
|
|
|
19,108 |
|
|
|
17,492 |
|
|
|
16,528 |
|
|
|
15,630 |
|
General and administrative |
|
13,197 |
|
|
|
13,680 |
|
|
|
10,849 |
|
|
|
9,459 |
|
|
|
13,006 |
|
Impairment charges |
|
- |
|
|
|
- |
|
|
|
- |
|
|
|
- |
|
|
|
1,691 |
|
Total expenses |
|
43,519 |
|
|
|
32,788 |
|
|
|
28,341 |
|
|
|
25,987 |
|
|
|
30,327 |
|
Income before other income (expense), net |
|
16,532 |
|
|
|
18,902 |
|
|
|
14,446 |
|
|
|
10,844 |
|
|
|
2,207 |
|
Other income (expense), net: |
|
|
|
|
|
|
|
|
|
|
|
|
|
|
|
|
|
|
|
Gain on extinguishment of debt |
|
- |
|
|
|
- |
|
|
|
- |
|
|
|
- |
|
|
|
3,934 |
|
Gain on settlement with former LongChamp shareholders |
|
- |
|
|
|
- |
|
|
|
- |
|
|
|
- |
|
|
|
1,470 |
|
Loss on forgiveness of notes receivable |
|
- |
|
|
|
- |
|
|
|
(34 |
) |
|
|
(508 |
) |
|
|
- |
|
Other income (expense) |
|
3,118 |
|
|
|
123 |
|
|
|
(210 |
) |
|
|
32 |
|
|
|
- |
|
Interest income |
|
92 |
|
|
|
145 |
|
|
|
187 |
|
|
|
231 |
|
|
|
213 |
|
Interest expense |
|
(447 |
) |
|
|
(304 |
) |
|
|
(164 |
) |
|
|
(241 |
) |
|
|
(467 |
) |
Change in value of options granted to equity holders |
|
- |
|
|
|
- |
|
|
|
- |
|
|
|
- |
|
|
|
134 |
|
Equity income (loss) from investments |
|
21 |
|
|
|
1,911 |
|
|
|
950 |
|
|
|
1,241 |
|
|
|
274 |
|
Total other income (expense), net |
|
2,784 |
|
|
|
1,875 |
|
|
|
729 |
|
|
|
755 |
|
|
|
5,558 |
|
Income before (provision) benefit for income taxes |
|
19,316 |
|
|
|
20,777 |
|
|
|
15,175 |
|
|
|
11,599 |
|
|
|
7,765 |
|
(Provision) benefit for income taxes |
|
(2,148 |
) |
|
|
(1,057 |
) |
|
|
(566 |
) |
|
|
(657 |
) |
|
|
321 |
|
Net income |
|
17,168 |
|
|
$ |
19,720 |
|
|
$ |
14,609 |
|
|
$ |
10,942 |
|
|
$ |
8,086 |
|
Less: net income attributable to non-controlling interests |
|
(3,478 |
) |
|
|
|
|
|
|
|
|
|
|
|
|
|
|
|
|
Net income attributable to Silvercrest |
$ |
13,690 |
|
|
|
|
|
|
|
|
|
|
|
|
|
|
|
|
|
|
|
|
|
|
|
|
|
|
|
|
|
|
|
|
|
|
|
|
|
Net income per share/unit: |
|
|
|
|
|
|
|
|
|
|
|
|
|
|
|
|
|
|
|
Basic |
$ |
1.68 |
|
|
$ |
1.87 |
|
|
$ |
1.46 |
|
|
|
|
|
|
|
|
|
Diluted |
$ |
1.63 |
|
|
$ |
1.84 |
|
|
$ |
1.40 |
|
|
|
|
|
|
|
|
|
|
|
|
|
|
|
|
|
|
|
|
|
|
|
|
|
|
|
|
|
Weighted average shares/units outstanding: |
|
|
|
|
|
|
|
|
|
|
|
|
|
|
|
|
|
|
|
Basic |
|
8,145,476 |
|
|
|
10,544,323 |
|
|
|
10,004,227 |
|
|
|
|
|
|
|
|
|
Diluted |
|
8,374,025 |
|
|
|
10,690,775 |
|
|
|
10,443,317 |
|
|
|
|
|
|
|
|
|
|
|
|
|
|
|
|
|
|
|
|
|
|
|
|
|
|
|
|
|
Dividend paid per share |
$ |
0.12 |
|
|
|
|
|
|
|
|
|
|
|
|
|
|
|
|
|
|
|
|
|
|
|
|
|
|
|
|
|
|
|
|
|
|
|
|
|
Selected statements of financial position data: |
|
|
|
|
|
|
|
|
|
|
|
|
|
|
|
|
|
|
|
Total assets |
$ |
100,727 |
|
|
$ |
52,454 |
|
|
$ |
45,262 |
|
|
$ |
33,079 |
|
|
$ |
29,964 |
|
Notes payable |
|
11,303 |
|
|
|
3,315 |
|
|
|
4,809 |
|
|
|
2,957 |
|
|
|
7,120 |
|
Total liabilities |
|
52,562 |
|
|
|
14,317 |
|
|
|
15,751 |
|
|
|
12,490 |
|
|
|
14,893 |
|
Redeemable partners’ capital |
|
- |
|
|
|
98,607 |
|
|
|
85,177 |
|
|
|
45,619 |
|
|
|
34,219 |
|
Stockholders’ equity/Partners’ deficit |
|
41,222 |
|
|
|
(60,470 |
) |
|
|
(55,666 |
) |
|
|
(25,030 |
) |
|
|
(19,148 |
) |
Non-controlling interests |
|
6,943 |
|
|
|
- |
|
|
|
- |
|
|
|
- |
|
|
|
- |
|
|
|
|
|
|
|
|
|
|
|
|
|
|
|
|
|
|
|
|
|
Selected unaudited operating data: |
|
|
|
|
|
|
|
|
|
|
|
|
|
|
|
|
|
|
|
Assets under management (in billions) (1) |
$ |
15.7 |
|
|
$ |
11.2 |
|
|
$ |
10.1 |
|
|
$ |
9.2 |
|
|
$ |
8.8 |
|
(1) | As of the last day of the period. |
Item 7. Management’s Discussion and Analysis of Financial Condition and Results of Operations
Overview
We are a premier, full-service wealth management firm focused on providing financial advisory and related family office services to ultra-high net worth individuals and endowments, foundations and other institutional investors. In addition to a wide range of investment capabilities, we offer a full suite of complementary and customized family office services for families seeking a
37
comprehensive oversight of their financial affairs. During the twelve months ended December 31, 2013, our assets under management grew 40.2% from $11.2 billion to $15.7 billion.
As part of the reorganization of Silvercrest L.P. that occurred in connection with our initial public offering, Silvercrest became the general partner of Silvercrest L.P, our operating company. The business includes the management of funds of funds, and other investment funds, collectively referred to as the “Silvercrest Funds”. In addition, the partnership units of all continuing partners of Silvercrest L.P. were converted to Class B units that have equal economic rights to our shares of Class A common stock. Silvercrest L.P. has issued deferred equity units exercisable for 175,298 Class B units which entitle the holders thereof to receive distributions from Silvercrest L.P. to the same extent as if the underlying Class B units were outstanding. Net profits and net losses of Silvercrest L.P. will be allocated, and distributions from Silvercrest L.P. will be made, to its current partners pro rata in accordance with their respective partnership units (and assuming the Class B units underlying all deferred equity units are outstanding).
The historical results of operations discussed in this Management’s Discussion and Analysis of Financial Condition and Results of Operations include those of Silvercrest L.P. and its subsidiaries. Following the completion of the reorganization of Silvercrest L.P., as the general partner of Silvercrest L.P., we control its business and affairs and, therefore, consolidate its financial results with ours. The interests of the limited partners’ collective 38.0% partnership interest in Silvercrest L.P. as of December 31, 2013 and for the period from July 1, 2013 through December 31, 2013, are reflected in Non-controlling interests in our consolidated financial statements. As a result of the reorganization being completed at the end of the second quarter of 2013, the accompanying Consolidated Statement of Financial Position as of December 31, 2012 and the results of operations and cash flows for the years ended December 31, 2012 and 2011 are those of Silvercrest L.P. For the year ended December 31, 2013, our net income, after amounts attributable to non-controlling interests, represents, on a weighted average basis, approximately 49.8% of Silvercrest L.P.’s net income.
Key Performance Indicators
When we review our performance, we focus on the indicators described below:
|
|
For the Years Ended December 31, |
|
|||||||||
(in thousands except as indicated) |
|
2013 |
|
|
2012 |
|
|
2011 |
|
|||
Revenue |
|
$ |
60,051 |
|
|
$ |
51,690 |
|
|
$ |
42,787 |
|
Income before other income (expense), net |
|
$ |
16,532 |
|
|
$ |
18,902 |
|
|
$ |
14,446 |
|
Net income |
|
$ |
17,168 |
|
|
$ |
19,720 |
|
|
$ |
14,609 |
|
Net income attributable to Silvercrest |
|
$ |
13,690 |
|
|
$ |
— |
|
|
$ |
— |
|
Adjusted EBITDA (1) |
|
$ |
17,324 |
|
|
$ |
14,702 |
|
|
$ |
10,839 |
|
Adjusted margin (2) |
|
|
28.9 |
% |
|
|
28.4 |
% |
|
|
25.3 |
% |
Assets under management at period end (billions) |
|
$ |
15.7 |
|
|
$ |
11.2 |
|
|
$ |
10.1 |
|
Average assets under management (billions) (3) |
|
$ |
13.5 |
|
|
$ |
10.7 |
|
|
$ |
9.7 |
|
(1) | EBITDA, a non -GAAP measure of earnings, represents net income before provision for income taxes, interest income, interest expense, depreciation and amortization. We define Adjusted EBITDA as EBITDA without giving effect to items including but not limited to professional fees associated with acquisitions or financing transactions, gains on extinguishment of debt or other obligations related to acquisitions, losses on disposals or abandonment of assets and leaseholds, severance and other similar expenses, but including partner incentive allocations, prior to our initial public offering, as an expense. We use this non-GAAP financial measure to assess the strength of our business. These adjustments and the non -GAAP financial measures that are derived from them provide supplemental information to analyze our business from period to period. Investors should consider these non-GAAP financial measures in addition to, and not as a substitute for financial measures in accordance with GAAP. |
(2) | Adjusted EBITDA margin is calculated by dividing Adjusted EBITDA by total revenue. |
(3) | We have computed average assets under management by averaging assets under management at the beginning of the applicable period and assets under management at the end of the applicable period. |
Revenue
We generate revenue from management and advisory fees, performance fees, and family office services fees. Our management and advisory fees are generated by managing assets on behalf of separate accounts and acting as investment adviser for various investment funds. Our performance fees relate to assets managed in external investment strategies in which we have a revenue sharing arrangement and in funds in which we have no partnership interest. Our management and advisory fees and family office services fees income is recognized through the course of the period in which these services are provided. Income from performance fees is recorded at the conclusion of the contractual performance period when all contingencies are resolved. In certain arrangements, we are only entitled to receive performance fees and allocations when the return on assets under management exceeds certain benchmark returns or other performance targets.
38
The discretionary investment management agreements for our separately managed accounts do not have a specified term. Rather, each agreement may be terminated by either party at any time, unless otherwise agreed with the client, upon written notice of termination to the other party. The investment management agreements for our private funds are generally in effect from year to year, and may be terminated at the end of any year (or, in certain cases, on the anniversary of execution of the agreement) (i) by us upon 30 or 90 days’ prior written notice and (ii) after receiving the affirmative vote of a specified percentage of the investors in the private fund that are not affiliated with us, by the private fund on 60 or 90 days’ prior written notice. The investment management agreements for our private funds may also generally be terminated effective immediately by either party where the non-terminating party (i) commits a material breach of the terms subject, in certain cases, to a cure period, (ii) is found to have committed fraud, gross negligence or willful misconduct or (iii) terminates, becomes bankrupt, becomes insolvent or dissolves. Each of our investment management agreements contains customary indemnification obligations from us to our clients. The tables below set forth the amount of assets under management, the percentage of management and advisory fees revenues, the amount of revenue recognized, and the average assets under management for discretionary managed accounts and for private funds for each period presented.
Discretionary Managed Accounts
|
|
As of and for the Year Ended December 31, |
|
|||||||||
(in billions) |
|
2013 |
|
|
2012 |
|
|
2011 |
|
|||
AUM concentrated in Discretionary Managed Accounts |
|
$ |
9.3 |
|
|
$ |
7.1 |
|
|
$ |
6.2 |
|
Average AUM For Discretionary Managed Accounts |
|
$ |
8.2 |
|
|
$ |
6.7 |
|
|
$ |
6.0 |
|
Discretionary Managed Accounts Revenue (in millions) |
|
$ |
44.5 |
|
|
$ |
37.6 |
|
|
$ |
32.5 |
|
Percentage of management and advisory fees revenue |
|
|
83% |
|
|
|
82 |
% |
|
|
86 |
% |
Private Funds
|
|
As of and for the Year Ended December 31, |
|
|||||||||
(in billions) |
|
2013 |
|
|
2012 |
|
|
2011 |
|
|||
AUM concentrated in Private Funds |
|
$ |
0.8 |
|
|
$ |
0.9 |
|
|
$ |
0.8 |
|
Average AUM For Private Funds |
|
$ |
0.9 |
|
|
$ |
0.9 |
|
|
$ |
0.8 |
|
Private Funds Revenue (in millions) |
|
$ |
9.0 |
|
|
$ |
8.5 |
|
|
$ |
5.4 |
|
Percentage of management and advisory fees revenue |
|
|
17% |
|
|
|
18 |
% |
|
|
14 |
% |
Our advisory fees are primarily driven by the level of our assets under management. Our assets under management increase or decrease based on the net inflows or outflows of funds into our various investment strategies and the investment performance of our clients’ accounts. In order to increase our assets under management and expand our business, we must develop and market investment strategies that suit the investment needs of our target clients and provide attractive returns over the long term. Our ability to continue to attract clients will depend on a variety of factors including, among others:
· | our ability to educate our target clients about our classic value investment strategies and provide them with exceptional client service; |
· | the relative investment performance of our investment strategies, as compared to competing products and market indices; |
· | competitive conditions in the investment management and broader financial services sectors; |
· | investor sentiment and confidence; and |
· | our decision to close strategies when we deem it to be in the best interests of our clients. |
The majority of advisory fees that we earn on separately-managed accounts are based on the value of assets under management on the last day of each calendar quarter. Most of our advisory fees are billed quarterly in advance on the first day of each calendar quarter. Our basic annual fee schedule for management of clients’ assets in separately managed accounts is: (i) for managed equity or balanced portfolios, 1% of the first $10 million and 0.60% on the balance, (ii) for managed fixed income only portfolios, 0.40% on the first $10 million and 0.30% on the balance and (iii) for the municipal value strategy, 0.65%. Our fee for monitoring non-discretionary assets can range from 0.05% to 0.01%, but can also be incorporated into an agreed-upon fixed family office service fee. The majority of our client relationships pay a blended fee rate since they are invested in multiple strategies.
Management fees earned on investment funds that we advise are calculated primarily based on the net assets of the funds. Some funds calculate investment fees based on the net assets of the funds as of the last business day of each calendar quarter, whereas other funds calculate investment fees based on the value of net assets on the first business day of the month. Depending on the investment fund, fees are paid either quarterly in advance or quarterly in arrears. For our private funds, the fees range from 0.25% to 1.5%
39
annually. Certain management fees earned on investment funds for which we perform risk management and due diligence services are based on flat fee agreements customized for each engagement.
Average management fee is calculated by dividing our actual revenue earned over a period by our average assets under management during the same period (which is calculated by averaging quarter-end assets under management for the applicable period). Our average management fee was 0.44%, 0.43% and 0.39% for the years ended December 31, 2013, 2012 and 2011, respectively. Changes in our total average management fee rates are typically the result of changes in the mix of our assets under management and increased concentration in our equities strategies whose fee rates are higher than those of other investment strategies. Advisory fees are also adjusted for any cash flows into or out of a portfolio, where the cash flow represents greater than 10% of the value of the portfolio. These cash flow-related adjustments were insignificant for the years ended December 31, 2013, 2012 and 2011. Silvercrest L.P. has authority to take fees directly from external custodian accounts of its separately managed accounts.
Our advisory fees may fluctuate based on a number of factors, including the following:
· | changes in assets under management due to appreciation or depreciation of our investment portfolios, and the levels of the contribution and withdrawal of assets by new and existing clients; |
· | allocation of assets under management among our investment strategies, which have different fee schedules; |
· | allocation of assets under management between separately managed accounts and advised funds, for which we generally earn lower overall advisory fees; and |
· | the level of our performance with respect to accounts and funds on which we are paid incentive fees. |
Our family office services capabilities enable us to provide comprehensive and integrated services to our clients. Our dedicated group of tax and financial planning professionals provide financial planning, tax planning and preparation, partnership accounting and fund administration and consolidated wealth reporting among other services. Family office services income fluctuates based on both the number of clients for whom we perform these services and the level of agreed-upon fees, most of which are flat fees. Therefore, non-discretionary assets under management, which are associated with family office services, do not typically serve as the basis for the amount of family office services revenue that is recognized. We have experienced a steady increase in family office services fees over the past few years as more of our separately managed accounts relationships have taken advantage of these services. We have also been successful in attracting new clients who have engaged us primarily for our family office services.
Expenses
Our expenses consist primarily of compensation and benefits expenses, as well as general and administrative expense including rent, professional services fees, data-related costs and sub-advisory fees. These expenses may fluctuate due to a number of factors, including the following:
· | variations in the level of total compensation expense due to, among other things, bonuses, awards of equity to our employees and partners of Silvercrest L.P., changes in our employee count and mix, and competitive factors; and |
· | the level of management fees from funds that utilize sub -advisors will affect the amount of sub- advisory fees. |
Our professional services fees have increased as a result of being a public company.
Compensation and Benefits Expense
Our largest expense is compensation and benefits, which includes the salaries, bonuses, equity-based compensation and related benefits and payroll costs attributable to our principals and employees. Our compensation methodology is intended to meet the following objectives: (i) support our overall business strategy; (ii) attract, retain and motivate top-tier professionals within the investment management industry; and (iii) align our employees’ interests with those of our equity owners. We have experienced, and expect to continue to experience, a general rise in compensation and benefits expense commensurate with growth in headcount and with the need to maintain competitive compensation levels.
Following the consummation of our initial public offering, we account for partner incentive distributions as an expense in our Statement of Operations. Accordingly, this has the effect of increasing compensation expense relative to the amounts that have been recorded historically in our financial statements.
40
The components of our compensation expenses for the years ended December 31, 2013, 2012 and 2011 are as follows:
|
|
For the Year Ended December 31, |
|
|||||||||
(in thousands) |
|
2013 |
|
|
2012 |
|
|
2011 |
|
|||
Cash compensation and benefits (1) |
|
$ |
28,360 |
|
|
$ |
17,726 |
|
|
$ |
16,495 |
|
Distributions on liability awards (2) |
|
|
13 |
|
|
|
28 |
|
|
|
20 |
|
Non-cash equity-based compensation expense |
|
|
1,949 |
|
|
|
1,354 |
|
|
|
977 |
|
Total compensation expense |
|
$ |
30,322 |
|
|
$ |
19,108 |
|
|
$ |
17,492 |
|
(1) | For the year ended December 31, 2013, $8,236 of partner incentive payments was included in cash compensation and benefits expense. |
(2) | Cash distributions on the portion of unvested deferred equity units that are subject to forfeiture are expensed when paid. The portion of unvested deferred equity units that can be settled in cash are classified as liability awards. |
On February 29, 2012, February 28, 2011 and February 24, 2010, Silvercrest L.P. and Silvercrest GP LLC, our predecessor, granted equity-based compensation awards to certain of their principals based on the fair value of the equity interests of Silvercrest L.P. and Silvercrest GP LLC. Each grant included a deferred equity unit and performance unit, subject to forfeiture and acceleration of vesting. As a result of the reorganization of Silvercrest L.P. and the initial public offering, each 100 deferred equity units represent the unsecured right to receive 100 Class B units of Silvercrest L.P., subject to vesting over a four-year period beginning on the first anniversary of the date of grant. Each deferred equity unit, whether vested or unvested, entitles the holder to receive distributions from Silvercrest L.P. as if such holder held such unit. Upon each vesting date, a holder may receive the number of units vested or a combination of the equivalent cash value of some of the units and units, but in no event may the holder receive more than 50% of the aggregate value of the vested units in cash. To the extent that holders elect to receive up to 50% of the aggregate value of the vested units in cash, we could have less cash to utilize. We have accounted for the distributions on the portion of the deferred equity units that are subject to forfeiture as compensation expense. Equity-based compensation expense will be recognized on the February 29, 2012, February 28, 2011 and February 24, 2010 grant dates of the deferred equity unit and performance unit awards through February 29, 2016, February 28, 2015 and February 24, 2014, respectively.
Each performance unit represents the right to receive one Class B unit of Silvercrest L.P. for each two units of Silvercrest L.P. issued upon vesting of the deferred equity units awarded to the employee, in each case subject to the achievement of defined performance goals. Although performance units will only vest upon the achievement of the performance goals, they are expensed over the same vesting period as the deferred equity units with which they are associated because there is an explicit service period.
General and Administrative Expenses
General and administrative expenses include occupancy-related costs, professional and outside services fees, office expenses, depreciation and amortization, sub-advisory fees and the costs associated with operating and maintaining our research, trading and portfolio accounting systems. Our costs associated with operating and maintaining our research, trading and portfolio accounting systems and professional services expenses generally increase or decrease in relative proportion to the number of employees retained by us and the overall size and scale of our business operations. Sub-advisory fees will fluctuate based on the level of management fees from funds that utilize sub-advisors.
As a result of the completion of our initial public offering, we will continue and expect to incur additional expenses as a result of being a public company for, among other things, directors and officers insurance, director fees, SEC reporting and compliance, including Sarbanes-Oxley compliance, transfer agent fees, professional fees and other similar expenses. These additional expenses have had, and will have the effect of reducing our net income.
Other Income
Other income is derived primarily from investment income arising from our investments in various private investment funds that were established as part of our investment strategies. We expect the investment components of other income, in the aggregate, to fluctuate based on market conditions and the success of our investment strategies. Performance fees earned from those investment funds in which we have a partnership interest have been earned over the past few years as a result of the achievement of various high water marks depending on the investment fund. These performance fees are recorded based on the equity method of accounting. The majority of our performance fees over the past few years have been earned from our fixed income-related funds.
Non-Controlling Interests
After the reorganization of Silvercrest L.P., we became the general partner of SLP and control its business and affairs and, therefore, consolidate its financial results with ours. In light of the limited partners’ interest in SLP, we reflect their partnership interests as non-controlling interests in our Consolidated Financial Statements.
41
Provision for Income Tax
While Silvercrest L.P. has historically not been subject to U.S. federal and certain state income taxes, it has been subject to the New York City Unincorporated Business Tax. As a result of the reorganization of Silvercrest L.P. and the completion of our initial public offering, we became subject to taxes applicable to C-corporations. Our effective tax rate, and the absolute dollar amount of our tax expense, has increased as a result of this reorganization which will be offset by the benefits of the tax receivable agreement entered into with our Class B stockholders.
Acquisition
On March 28, 2013, we acquired certain assets of Ten-Sixty Asset Management, LLC. Ten-Sixty Asset Management, LLC was a registered investment adviser that advised on approximately $1.9 billion of assets primarily on behalf of institutional clients. This strategic acquisition expands our hedge fund due diligence capabilities and continues the growth of our institutional business. Under the terms of the asset purchase agreement, we paid cash consideration at closing of $2.5 million and issued a promissory note to Ten-Sixty Asset Management, LLC for $1.5 million subject to adjustment. As of December 31, 2013, the aggregate principal amount of the promissory note is approximately $1.1 million which is payable in quarterly installments from June 30, 2014 through March 31, 2017 of $0.1 million each.
Operating Results
Revenue
Our revenues for the years ended December 31, 2013, 2012 and 2011 are set forth below:
For the Years Ended December 31, |
|
||||||||||||||||||
(in thousands) |
|
2013 |
|
|
2012 |
|
|
2013 vs. 2012 ($) |
|
|
2013 vs. 2012 (%) |
|
|||||||
Management and advisory fees |
|
|
$ |
53,465 |
|
|
$ |
|
46,069 |
|
|
$ |
|
7,396 |
|
|
|
16.1 |
% |
Performance fees and allocations |
|
|
|
1,830 |
|
|
|
|
714 |
|
|
|
|
1,116 |
|
|
|
156.3 |
% |
Family office services |
|
|
|
4,756 |
|
|
|
|
4,907 |
|
|
|
|
(151) |
|
|
|
(3.1) |
% |
Total revenue |
|
|
$ |
60,051 |
|
|
$ |
|
51,690 |
|
|
$ |
|
8,361 |
|
|
|
16.2 |
% |
For the Years Ended December 31, |
|
|||||||||||||||
(in thousands) |
|
2012 |
|
|
2011 |
|
|
2012 vs. 2011 ($) |
|
|
2012 vs. 2011 (%) |
|
||||
Management and advisory fees |
|
$ |
46,069 |
|
|
$ |
37,869 |
|
|
$ |
8,200 |
|
|
|
21.7 |
% |
Performance fees and allocations |
|
|
714 |
|
|
|
85 |
|
|
|
629 |
|
|
|
740.0 |
% |
Family office services |
|
|
4,907 |
|
|
|
4,833 |
|
|
|
74 |
|
|
|
1.5 |
% |
Total revenue |
|
$ |
51,690 |
|
|
$ |
42,787 |
|
|
$ |
8,903 |
|
|
|
20.8 |
% |
The growth in our assets under management from January 1, 2011 to December 31, 2013 is described below:
|
|
Assets Under Management |
|
|||||||||
(in billions) |
|
Discretionary |
|
|
Non- |
|
|
Total |
|
|||
As of January 1, 2011 |
|
$ |
6.3 |
|
|
$ |
2.9 |
|
|
$ |
9.2 |
|
Gross client inflows |
|
|
3.8 |
|
|
|
1.5 |
|
|
|
5.3 |
|
Gross client outflows |
|
|
(3.1 |
) |
|
|
(1.2 |
) |
|
|
(4.3 |
) |
Market appreciation (depreciation) |
|
|
0.1 |
|
|
|
(0.1 |
) |
|
|
— |
|
As of December 31, 2011 |
|
|
7.0 |
|
|
|
3.1 |
|
|
|
10.1 (1) |
|
Gross client inflows |
|
|
6.7 |
|
|
|
0.6 |
|
|
|
7.3 |
|
Gross client outflows |
|
|
(6.3 |
) |
|
|
(0.6 |
) |
|
|
(6.9 |
) |
Market appreciation |
|
|
0.5 |
|
|
|
0.1 |
|
|
|
0.6 |
|
As of December 31, 2012 |
|
|
8.0 |
|
|
|
3.1 |
|
|
|
11.2 (1) |
|
Gross client inflows |
|
|
3.5 |
|
|
|
2.5 |
|
|
|
6.0 |
|
Gross client outflows |
|
|
(3.0) |
|
|
|
(0.8) |
|
|
|
(3.8) |
|
Market appreciation |
|
|
1.6 |
|
|
|
0.7 |
|
|
|
2.3 |
|
As of December 31, 2013 |
|
$ |
10.1 |
|
|
$ |
5.6 |
|
|
$ |
15.7 (1 |
) |
(1) | Less than 5% of assets under management generate performance fees. |
42
Year Ended December 31, 2013 versus Year Ended December 31, 2012
Our total revenue increased by $8.4 million, or 16.2%, to $60.1 million for year ended December 31, 2013, from $51.7 million for year ended December 31, 2012. This increase was driven primarily by growth in our management and advisory fees as a result of increased assets under management.
Assets under management increased by $4.5 billion, or 40.2%, to $15.7 billion at December 31, 2013 from $11.2 billion at December 31, 2012. Compared to the year ended December 31, 2012, there was a decrease of $1.3 billion of client inflows, a decrease of $3.1 billion in client outflows, and an increase of $1.7 billion in market appreciation. Our market appreciation during the year ended December 31, 2013 constituted a 20.5% rate of increase in our total assets under management compared to December 31, 2012. Our growth in assets under management for the year ended December 31, 2013 was attributable to an increase of $2.1 billion and $2.5 billion in discretionary and non-discretionary assets under management, respectively, primarily related to the Ten-Sixty Asset Management, LLC acquisition. The growth in our discretionary assets under management was primarily driven by an increase in separately managed accounts. An increase in the concentration of equity securities, which are included in discretionary assets under management and whose fee rates are higher than those of other investments, was the primary driver of increased management and advisory fees revenue for the year ended December 31, 2013 compared to the prior year. Sub-advised fund management revenue increased by $0.3 million to $1.2 million for the year ended December 31, 2013 from $0.9 million for the same period in the prior year as a result of the Ten-Sixty Asset Management, LLC acquisition. Proprietary fund management revenue remained flat for the year ended December 31, 2013 as compared to the same period in the prior year. With respect to our discretionary assets under management, equity assets experienced growth of 25.7% during the year ended December 31, 2013, while fixed income assets decreased by 1.7% during the same period. For the year ended December 31, 2013, most of our growth came from our small cap value, focused value and equity income strategies with composite returns of 27.1%, 27.0% and 22.7%, respectively. As of December 31, 2013, the composition of our assets under management was 64% in discretionary assets, which includes both separately managed accounts and proprietary and sub-advised funds, and 36% in non-discretionary assets which represent assets on which we provide portfolio reporting but do not have investment discretion.
Performance fee revenue increased by $1.1 million to $1.8 million for the year ended December 31, 2013 from $0.7 million for the year ended December 31, 2011. These performance fees are primarily related to external investment strategies in which we have a revenue sharing arrangement. The increase in performance fee revenue is directly attributable to higher returns achieved at our external investment strategies.
Year Ended December 31, 2012 versus Year Ended December 31, 2011
Our total revenue increased by $8.9 million, or 20.8%, to $51.7 million for the year ended December 31, 2012, from $42.8 million for the year ended December 31, 2011. This increase was driven primarily by growth in our management and advisory fees as a result of increased assets under management.
Assets under management increased by $1.1 billion, or 10.9%, to $11.2 billion at December 31, 2012 from $10.1 billion at December 31, 2011. Contributing to the growth in assets under management was $7.3 billion of client inflows and $0.7 billion in market appreciation, partially offset by client outflows of $6.9 billion. Our market appreciation during the year ended December 31, 2012 constituted a 6.9% rate of increase in our total assets under management compared to the year ended December 31, 2011. Our growth in assets under management for the year ended December 31, 2012 was primarily attributable to an increase of $0.9 billion in separately managed accounts, which are included in discretionary assets under management. An increase in the concentration of equity securities, which are included in discretionary assets under management and whose fee rates are higher than those of other investments, was the primary driver of increased management and advisory fees revenue for the year ended December 31, 2012 compared to the prior year. Sub-advised fund management revenue decreased by $0.4 million to $1.2 million for the year ended December 31, 2012 from $1.6 million in the prior year. While sub-advised fund assets under management remained flat as of December 31, 2012 as compared to December 31, 2011, client redemptions primarily contributed to the decrease in sub-advised fund management revenue. Proprietary fund management revenue increased by $3.5 million to $7.3 million for the year ended December 31, 2012 from $3.8 million for the same period in the prior year. This increase in proprietary fund management revenue was attributable to the acquisition of Milbank Winthrop & Co., Inc., or Milbank, in November 2011. With respect to our discretionary assets under management, equity assets experienced growth of 30.5% during the year ended December 31, 2012 while fixed income assets were flat during the same period. Most of our growth came from our SMID cap, multi cap and small cap value strategies with composite returns of 16.7%, 16.5% and 16.0%, respectively. As of December 31, 2012, the composition of our assets under management was 72% in discretionary assets, which includes both separately managed accounts and proprietary and sub-advised funds, and 28% in non-discretionary assets which represent assets on which we provide portfolio reporting but do not have investment discretion.
Performance fee revenue increased by $629 thousand to $714 thousand for the year ended December 31, 2012 from $85 thousand for the year ended December 31, 2011. These performance fees are primarily related to external investment strategies in which we have a revenue sharing arrangement. The increase in performance fee revenue is directly attributable to higher returns
43
achieved at our external investment strategies. The balance of our performance fees are earned from proprietary funds and are included in equity income from investments, which is discussed below in “—Other Income (Expense).”
Expenses
Our expenses for the years ended December 31, 2013, 2012 and 2011 are set forth below:
For the Years Ended December 31, |
|
|||||||||||||||
(in thousands) |
|
2013 |
|
|
2012 |
|
|
2013 vs. 2012 ($) |
|
|
2013 vs. 2012 (%) |
|
||||
Compensation and benefits (1) |
|
$ |
30,322 |
|
|
$ |
19,108 |
|
|
$ |
11,214 |
|
|
|
58.7 |
% |
General, administrative and other |
|
|
13,197 |
|
|
|
13,680 |
|
|
|
(483) |
|
|
|
-3.5 |
% |
Total expenses |
|
|
43,519 |
|
|
$ |
32,788 |
|
|
$ |
10,731 |
|
|
|
32.7 |
% |
For the Years Ended December 31, |
|
|||||||||||||||
(in thousands) |
|
2012 |
|
|
2011 |
|
|
2012 vs. 2011 ($) |
|
|
2012 vs. 2011 (%) |
|
||||
Compensation and benefits |
|
$ |
19,108 |
|
|
$ |
17,492 |
|
|
$ |
1,616 |
|
|
|
9.2 |
% |
General, administrative and other |
|
|
13,680 |
|
|
|
10,849 |
|
|
|
2,831 |
|
|
|
26.1 |
% |
Total expenses |
|
$ |
32,788 |
|
|
$ |
28,341 |
|
|
$ |
4,447 |
|
|
|
15.7 |
% |
(3) | For the year ended December 31, 2013, $8,236 of partner incentive payments was included in compensation and benefits expense. |
Our expenses are driven primarily by our compensation costs. The table included in “—Expenses—Compensation and Benefits Expense” describes the components of our compensation expense for the three years ended December 31, 2013. Other expenses, such as rent, professional service fees, data-related costs, and sub-advisory fees incurred are included in our general and administrative expenses.
Year Ended December 31, 2013 versus Year Ended December 31, 2012
Total expenses increased by $10.7 million, or 32.7%, to $43.5 million for the year ended December 31, 2013 from $32.8 million for the year ended December 31, 2012. This increase was primarily attributable to increases in compensation and benefits expense of $11.2 million partially offset by a decrease in general and administrative expenses of $0.5 million.
Compensation and benefits expense increased by $11.2 million, or 58.7%, to $30.3 million for the year ended December 31, 2013 from $19.1 million for the year ended December 31, 2012. The increase was primarily attributable to an increase in the accrual for bonuses of $8.2 million as a result of the recognition of partner incentive payments as compensation expense, special non-principal bonuses of $0.8 million that were paid in July 2013 upon consummation of our initial public offering, an increase in salaries and benefits expense of $0.8 million and $0.2 million, respectively, as a result of both merit increases and increased headcount, and increased equity-based compensation expense of $0.8 million primarily due to an increase in the fair value of the deferred equity units in addition to the acceleration of vesting of deferred equity units as a result of the death of our former Chief Executive Officer.
General and administrative expenses decreased by $0.5 million, or 3.5%, to $13.2 million for the year ended December 31, 2013 from $13.7 million for the year ended December 31, 2012. This decrease was primarily due to a reduction in professional fees of $2.5 million as a result of incurring fees for services rendered in the prior year in connection with a planned initial public offering that was withdrawn in 2012 and acquisition transactions. Furthermore, our sub-advisory fees decreased by $0.3 million as a result of the Ten-Sixty Asset Management, LLC acquisition. Partially offsetting these decreases was a $0.8 million charge for payments to be made through November 2014 to a relative of our former Chief Executive Officer, an increase in occupancy expense of $0.6 million due to the reversal of a lease abandonment liability in 2012 that was originally recorded in 2009 in connection with reoccupying space in our headquarters resulting in reduced occupancy expenses in 2012, an increase in investor relation costs of $0.2 million, an increase in recruiting costs of $0.1 million, an increase in client promotion costs of $0.2 million, Delaware franchise taxes of $0.1 million, and a fair value adjustment of $0.2 million to the Milbank acquisition.
Year Ended December 31, 2012 versus Year Ended December 31, 2011
Total expenses increased by $4.5 million, or 15.7%, to $32.8 million for the year ended December 31, 2012 from $28.3 million for the year ended December 31, 2011. This increase was primarily attributable to increases in compensation and benefits expense and general and administrative expenses of $1.6 million and $2.8 million, respectively.
Compensation and benefits expense increased by $1.6 million, or 9.2%, to $19.1 million for the year ended December 31, 2012 from $17.5 million for the year ended December 31, 2011. The increase was primarily attributable to an increase in salaries of $0.9 million as a result of both merit increases and increased headcount primarily as a result of the Milbank acquisition, increased incentive
44
compensation expense of $0.3 million, and increased equity-based compensation expense of $0.3 million due to the grant of additional deferred equity units to employees and an increase in the fair value of the deferred equity units.
General and administrative expenses increased by $2.8 million, or 26.1%, to $13.7 million for the year ended December 31, 2012 from $10.9 million for the year ended December 31, 2011. This increase was primarily due to an increase in professional fees of $2.3 million for services rendered in connection with a planned initial public offering that was withdrawn in November 2012 and acquisition transactions and depreciation and amortization expense of $0.4 million primarily related to amortization of intangible assets as part of the Milbank transaction.
On May 1, 2012, we reoccupied space at our headquarters that we had previously abandoned in 2009. As a result, this released the remaining abandonment-related liability of $0.7 million. This reversal was partially offset by increased operating cost escalations of $0.2 million and lower sub-tenant rent of $0.2 million.
Other Income (Expense), Net
For the Years Ended December 31, |
|
|||||||||||||||
(in thousands) |
|
2013 |
|
|
2012 |
|
|
2013 vs. 2012 ($) |
|
|
2013 vs. 2012 (%) |
|
||||
Other income (expense), net |
|
$ |
3,118 |
|
|
$ |
123 |
|
|
$ |
2,995 |
|
|
|
NM |
|
Interest income |
|
|
92 |
|
|
|
145 |
|
|
|
(53) |
|
|
|
-36.6 |
% |
Interest expense |
|
|
(447) |
|
|
|
(304 |
) |
|
|
(143) |
|
|
|
-47.0 |
% |
Equity income from investments |
|
|
21 |
|
|
|
1,911 |
|
|
|
(1,890) |
|
|
|
-98.9 |
% |
Total other income (expense), net |
|
$ |
2,784 |
|
|
$ |
1,875 |
|
|
$ |
909 |
|
|
|
48.5 |
% |
For the Years Ended December 31, |
|
|||||||||||||||
(in thousands) |
|
2012 |
|
|
2011 |
|
|
2012 vs. 2011 ($) |
|
|
2012 vs. 2011 (%) |
|
||||
Loss on forgiveness of notes receivable |
|
$ |
— |
|
|
$ |
(34 |
) |
|
$ |
34 |
|
|
|
-100.0 |
% |
Other income (expense), net |
|
|
123 |
|
|
|
(210 |
) |
|
|
333 |
|
|
|
-41.4 |
% |
Interest income |
|
|
145 |
|
|
|
187 |
|
|
|
(42 |
) |
|
|
-22.5 |
% |
Interest expense |
|
|
(304 |
) |
|
|
(164 |
) |
|
|
(140 |
) |
|
|
85.4 |
% |
Equity income from investments |
|
|
1,911 |
|
|
|
950 |
|
|
|
961 |
|
|
|
-158.6 |
% |
Total revenue |
|
$ |
1,875 |
|
|
$ |
729 |
|
|
$ |
1,146 |
|
|
|
157.2 |
% |
Year Ended December 31, 2013 versus Year Ended December 31, 2012
Other income (expense), net increased by $0.9 million to $2.8 million for the year ended December 31, 2013 from $1.9 million for the year ended December 31, 2012 primarily due to the receipt of $3.0 million in life insurance proceeds by the Company which was the beneficiary of a key-man policy in the name of our former Chief Executive Officer. Partially offsetting the proceeds was a decrease in equity income from investments of $1.9 million resulting from decreased performance fee allocations. Interest expense increased for the year ended December 31, 2013 as compared to the prior year as a result of borrowings under our credit facility, the issuance of a note related to the Ten-Sixty acquisition and notes issued to two former partners in conjunction with their share redemptions prior to our initial public offering.
Year Ended December 31, 2012 versus Year Ended December 31, 2011
Other income (expense), net increased by $1.1 million to $1.9 million for the year ended December 31, 2012 from $0.7 million for the year ended December 31, 2011. The increase in other income (expense), net is attributable to a $1.0 million increase in equity income from investments resulting from performance fee allocations partially offset by net interest expense of $0.2 million as a result of a write off prepaid interest expense related to the reversal of a lease abandonment liability in addition to an increase in notes payable issued in connection with the acquisition of Milbank.
Provision for Income Taxes
Year Ended December 31, 2013 versus Year Ended December 31, 2012
The provision for income taxes was $2.1 million and $1.1 million for the years ended December 31, 2013 and 2012, respectively. The change was a result of both the recognition of corporate income tax expense related to the change in our corporate structure and an increase in taxable income. Our provision for income taxes as a percentage of income before provision for income taxes for the years ended December 31, 2013 and 2012 was 11.1% and 5.1%, respectively.
45
Year Ended December 31, 2012 versus Year Ended December 31, 2011
The provision for income taxes was $1.1 million and $0.6 million for the years ended December 31, 2012 and December 31, 2011, respectively. The change was a result of an increase in taxable income. Our provision for income taxes as a percentage of income before provision for income taxes for the year ended December 31, 2012 was 5.1% compared to 3.7% for the year ended December 31, 2011.
Supplemental Non-GAAP Financial Information
To provide investors with additional insight, promote transparency and allow for a more comprehensive understanding of the information used by management in its financial and operational decision-making, we supplement our consolidated financial statements presented on a basis consistent with U.S. generally accepted accounting principles, or GAAP, with Adjusted EBITDA, Adjusted EBITDA margin, Adjusted Net Income, and Adjusted Earnings Per Share which are non-GAAP financial measures of earnings.
· | EBITDA represents net income before provision for income taxes, interest income, interest expense, depreciation and amortization. We define Adjusted EBITDA as EBITDA without giving effect to the Delaware franchise tax, professional fees associated with acquisitions or financing transactions, losses on forgiveness of notes receivable from our principals, gains on extinguishment of debt or other obligations related to acquisitions, impairment charges and losses on disposals or abandonment of assets and leaseholds, client reimbursements and fund redemption costs, severance and other similar expenses, but including partner incentive allocations, prior to our initial public offering, as an expense. |
· | Adjusted EBITDA Margin is calculated by dividing Adjusted EBITDA by total revenue. |
· | Adjusted Net Income represents recurring net income without giving effect to professional fees associated with acquisitions or financing transactions, losses on forgiveness of notes receivable from our principals, gains on extinguishment of debt or other obligations related to acquisitions, impairment charges and losses on disposals or abandonment of assets and leaseholds, client reimbursements and fund redemption costs, severance and other similar expenses, but including partner incentive allocations, prior to our initial public offering, as an expense. Furthermore, Adjusted Net Income includes income tax expense assuming a corporate rate of 40%. |
· | Adjusted Earnings Per Share represents Adjusted Net Income divided by the actual Class A and Class B shares outstanding as of the end of the reporting period for basic Adjusted Earnings Per Share, and to the extent dilutive, we add unvested deferred equity units and performance units to the total shares outstanding to compute diluted Adjusted Earnings Per Share. As a result of our structure, which includes a non-controlling interest, we feel that it is important to management and investors to supplement our consolidated financial statements presented on a GAAP basis with Adjusted Earnings Per Share, a non-GAAP financial measure of earnings, as this measure provides a perspective of recurring earnings per share of the company as a whole as opposed to being limited to our Class A common stock. |
These adjustments, and the non-GAAP financial measures that are derived from them, provide supplemental information to analyze our operations between periods and over time. Investors should consider our non-GAAP financial measure in addition to, and not as a substitute for, financial measures prepared in accordance with GAAP.
46
The following tables contain reconciliations of net income to Adjusted EBITDA, Adjusted Net Income and Adjusted Earnings Per Share (amounts in thousands except per share amounts).
Adjusted EBITDA
|
Year Ended December 31, |
|
|||||||||
|
2013 |
|
|
2012 |
|
|
2011 |
|
|||
Reconciliation of non-GAAP financial measure: |
|
|
|
|
|
|
|
|
|
|
|
Net income |
$ |
17,168 |
|
|
$ |
19,720 |
|
|
$ |
14,609 |
|
Provision for income taxes |
|
2,148 |
|
|
|
1,057 |
|
|
|
566 |
|
Delaware Franchise Tax |
|
125 |
|
|
|
- |
|
|
|
- |
|
Interest expense |
|
447 |
|
|
|
304 |
|
|
|
164 |
|
Interest income |
|
(92 |
) |
|
|
(145 |
) |
|
|
(187 |
) |
Partner incentive allocations (A) |
|
(6,000 |
) |
|
|
(12,129 |
) |
|
|
(8,775 |
) |
Depreciation and amortization |
|
1,944 |
|
|
|
1,918 |
|
|
|
1,469 |
|
Equity-based compensation |
|
2,222 |
|
|
|
1,416 |
|
|
|
1,060 |
|
Other adjustments (B) |
|
(639 |
) |
|
|
2,561 |
|
|
|
1,933 |
|
Adjusted EBITDA |
$ |
17,324 |
|
|
$ |
14,702 |
|
|
$ |
10,839 |
|
Adjusted EBITDA Margin |
|
28.8 |
% |
|
|
28.4 |
% |
|
|
25.3 |
% |
Adjusted Net Income and Adjusted Earnings
|
|
|
|
|
|
|
|
|
|
|
|
Reconciliation of non-GAAP financial measure: |
|
|
|
|
|
|
|
|
|
|
|
Net income |
$ |
17,168 |
|
|
$ |
19,720 |
|
|
$ |
14,609 |
|
GAAP Provision for income taxes |
|
2,148 |
|
|
|
1,057 |
|
|
|
566 |
|
Delaware Franchise Tax |
|
125 |
|
|
|
- |
|
|
|
- |
|
Partner incentive allocations (A) |
|
(6,000 |
) |
|
|
(12,129 |
) |
|
|
(8,775 |
) |
Other adjustments (B) |
|
(639 |
) |
|
|
2,561 |
|
|
|
1,933 |
|
Adjusted earnings before provision for income taxes |
|
12,802 |
|
|
|
11,209 |
|
|
|
8,333 |
|
Adjusted provision for income taxes: |
|
|
|
|
|
|
|
|
|
|
|
Adjusted provision for income taxes (40% assumed tax rate) |
|
(5,121 |
) |
|
|
(4,484 |
) |
|
|
(3,333 |
) |
|
|
|
|
|
|
|
|
|
|
|
|
Adjusted net income |
$ |
7,681 |
|
|
$ |
6,725 |
|
|
$ |
5,000 |
|
Adjusted earnings per share/unit: |
|
|
|
|
|
|
|
|
|
|
|
Basic |
$ |
0.64 |
|
|
$ |
0.66 |
|
|
$ |
0.50 |
|
Diluted |
$ |
0.62 |
|
|
$ |
0.63 |
|
|
$ |
0.47 |
|
Shares/units outstanding: |
|
|
|
|
|
|
|
|
|
|
|
Basic Class A shares outstanding |
|
7,523 |
|
|
|
- |
|
|
|
- |
|
Basic Class B shares/units outstanding |
|
4,465 |
|
|
|
10,213 |
|
|
|
10,079 |
|
Total basic shares/units outstanding |
|
11,988 |
|
|
|
10,213 |
|
|
|
10,079 |
|
Diluted Class A shares outstanding |
|
7,523 |
|
|
|
- |
|
|
|
- |
|
Diluted Class B shares/units outstanding |
|
4,869 |
|
|
|
10,689 |
|
|
|
10,664 |
|
Total diluted shares/units outstanding |
|
12,392 |
|
|
|
10,689 |
|
|
|
10,664 |
|
(A) | Partner incentive allocations, prior to our initial public offering, were treated as distributions of net income and recorded when paid. Upon the completion of our reorganization and initial public offering, we account for partner incentive payments as an expense in our Statement of Operations and have reflected the related adjustments in our historical financial information. Accordingly, this has the effect of increasing compensation expense relative to the amounts that have been recorded historically in our financial statements. |
47
|
Year Ended December 31, |
||||||||||
|
2013 |
|
|
2012 |
|
|
2011 |
|
|||
(B) Other adjustments consist of the following: |
|
|
|
|
|
|
|
|
|
|
|
Loss on forgiveness of notes receivable (a) |
$ |
- |
|
|
$ |
- |
|
|
$ |
34 |
|
Loss on sub-lease (b) |
|
(77 |
) |
|
|
(85 |
) |
|
|
150 |
|
Lease abandonment (reversal)/charge (c) |
|
- |
|
|
|
(662 |
) |
|
|
- |
|
Client reimbursement |
|
249 |
|
|
|
12 |
|
|
|
- |
|
Fund redemption costs (d) |
|
- |
|
|
|
(4 |
) |
|
|
827 |
|
IPO professional fees |
|
83 |
|
|
|
2,892 |
|
|
|
578 |
|
Initial public offering-related non-principal bonuses |
|
754 |
|
|
|
- |
|
|
|
- |
|
Acquisition costs (e) |
|
127 |
|
|
|
121 |
|
|
|
222 |
|
Severance |
|
- |
|
|
|
79 |
|
|
|
69 |
|
Life insurance proceeds (f) |
|
(3,010 |
) |
|
|
- |
|
|
|
- |
|
Other (g) |
|
1,235 |
|
|
|
208 |
|
|
|
53 |
|
Total other adjustments |
|
(639 |
) |
|
|
2,561 |
|
|
|
1,933 |
|
(a) | Represents remaining balance on notes originally issued in connection with the issuance of equity that were forgiven in connection with the termination of principals. |
(b) | Reflects the amortization recognized, on a present value basis, between the per square foot rental rate for our Company’s primary lease and a sub-lease that we signed in 2011 with a sub-tenant for our headquarters in New York. |
(c) | Reflects a charge and subsequent reversal of the remaining rent expense on a portion of our unutilized space at our headquarters that we abandoned in 2009 and reoccupied in May 2012. A portion of this space is subleased through September 29, 2017. |
(d) | Includes the costs associated with the reimbursement to one of our funds for the difference between the value of certain investor redemptions and the actual proceeds of the underlying securities in 2012 and 2011. |
(e) | Reflects the legal and accounting fees associated with the closing of the Ten-Sixty Asset Management, LLC acquisition in 2013, legal fees related to various strategic initiatives in 2013, the MW Commodity Advisors, LLC acquisition in 2012, and the Milbank acquisition in 2011. Also reflects transition expenses related to integrating the Ten-Sixty Asset Management, LLC acquisition in 2013, and expenses related to relocating Milbank personnel and operations to our headquarters that were incurred during the year ended December 31, 2012. |
(f) | Represents proceeds to the Company which was the beneficiary on a key-man policy in the name of our former Chief Executive Officer |
(g) | In 2013, represents the accrual of Quarterly Income Payments, as defined in the MW Commodity Advisors, LLC purchase agreement, a fair value adjustment to the Milbank contingent purchase price consideration of $148, and a $781 charge related to payments to be made through November 2014 to a relative of our former Chief Executive Officer and $30 in related legal fees. Also, $37 of legal fees related to the simultaneous redemption and contribution of investors of one of the Silvercrest funds into one of the Milbank funds. In 2012, represents a fair value adjustment to the Milbank contingent consideration of ($42), a non-recurring catch-up operating expense escalation from our landlord of $97, and $153 of expenses incurred related to our 10th anniversary client event. In 2011, professional fees related to the Milbank acquisition and a Silvercrest fund. |
Liquidity and Capital Resources
Historically, the working capital needs of our business have primarily been met through cash generated by our operations. We expect that our cash and liquidity requirements in the next twelve months will be met primarily through cash generated by our operations.
On June 24, 2013, the subsidiaries of Silvercrest L.P. entered into a $15.0 million credit facility with City National Bank. The subsidiaries of Silvercrest L.P. are the borrowers under such facility and Silvercrest L.P. guarantees the obligations of its subsidiaries under the credit facility. The credit facility is secured by certain assets of Silvercrest L.P. and its subsidiaries. The credit facility consists of a $7.5 million delayed draw term loan that matures on June 24, 2020 and a $7.5 million revolving credit facility that matures on December 24, 2016. The loan bears interest at either (a) the higher of the prime rate plus a margin of 0.05 percentage points and 2.5% or (b) the LIBOR rate plus 3 percentage points, at the borrowers’ option. On June 28, 2013, the borrowers borrowed $7 million under the revolving credit facility to partially fund a $10.0 million distribution that was made in July 2013 to the existing limited partners of Silvercrest L.P. prior to the closing of our initial public offering. As of December 31, 2013, $3.0 million of borrowings remained outstanding on the revolving credit facility. As of December 31, 2013, no amount has been drawn on the term loan credit facility and the borrowers may draw up to the full amount of the term loan through June 25, 2018. Borrowings under the term loan on or prior to June 24, 2015 will be payable in twenty equal quarterly installments. Borrowings under the term loan after June 24, 2015 will be payable in equal quarterly installments through the maturity date. The new credit facility contains restrictions on, among other things, (i) incurrence of additional debt, (ii) creating liens on certain assets, (iii) making certain investments,
48
(iv) consolidating, merging or otherwise disposing of substantially all of our assets, (v) the sale of certain assets, and (vi) entering into transactions with affiliates. In addition, the credit facility contains certain financial covenants including a test on discretionary assets under management, maximum debt to EBITDA and a fixed charge coverage ratio. The credit facility contains customary events of default, including the occurrence of a change in control which includes a person or group of persons acting together acquiring more than 30% of total voting securities of Silvercrest. Any undrawn amounts under this facility would be available to fund future acquisitions or for working capital purposes, if needed. We were in compliance with the covenants under the credit facility as of December 31, 2013.
Our ongoing sources of cash will primarily consist of management fees and family office services fees, which are principally collected quarterly. We will primarily use cash flow from operations to pay compensation and related expenses, general and administrative expenses, income taxes, debt service, capital expenditures, distributions to Class B unit holders and dividends on shares of our Class A common stock.
Seasonality typically affects cash flow since the first quarter of each year includes as a source of cash, the prior year’s annual performance fee payments, if any, from our various funds and external investment strategies and, as a use of cash, the prior fiscal year’s incentive compensation. We believe that we have sufficient cash from our operations to fund our operations and commitments for the next twelve months.
The following table sets forth certain key financial data relating to our liquidity and capital resources as of December 31, 2013 and December 31, 2012.
|
|
Years Ended December 31, |
|
|||||||||
(in thousands) |
|
2013 |
|
|
2012 |
|
|
2011 |
|
|||
Cash and cash equivalents |
|
$ |
27,122 |
|
|
$ |
13,443 |
|
|
$ |
7,354 |
|
Accounts receivable |
|
$ |
5,405 |
|
|
$ |
3,675 |
|
|
$ |
2,238 |
|
Due from Silvercrest Funds |
|
$ |
2,653 |
|
|
$ |
1,622 |
|
|
$ |
2,043 |
|
We anticipate that distributions to the limited partners of Silvercrest L.P. will continue to be a material use of our cash resources and will vary in amount and timing based on our operating results and dividend policy. We pay and intend to continue paying quarterly cash dividends to holders of our Class A common stock. We are a holding company and have no material assets other than our ownership of interests in Silvercrest L.P. As a result, we will depend upon distributions from Silvercrest L.P. to pay any dividends to our Class A stockholders. We expect to cause Silvercrest L.P. to make distributions to us in an amount sufficient to cover dividends, if any, declared by us. Our dividend policy has certain risks and limitations, particularly with respect to liquidity. Although we expect to pay dividends according to our dividend policy, we may not pay dividends according to our policy, or at all, if, among other things, we do not have the cash necessary to pay our intended dividends or our subsidiaries are prevented from making a distribution to us under the terms of our current credit facility or any future financing. To the extent we do not have cash on hand sufficient to pay dividends, we may decide not to pay dividends. By paying cash dividends rather than investing that cash in our future growth, we risk slowing the pace of our growth, or not having a sufficient amount of cash to fund our operations or unanticipated capital expenditures, should the need arise.
Our purchase of Class B units in Silvercrest L.P. that occurred concurrently with the consummation of our initial public offering, and the future exchanges of Class B units of Silvercrest L.P., are expected to result in increases in our share of the tax basis of the tangible and intangible assets of Silvercrest L.P. at the time of our acquisition and these future exchanges, which will increase the tax depreciation and amortization deductions that otherwise would not have been available to us. These increases in tax basis and tax depreciation and amortization deductions are expected to reduce the amount of tax that we would otherwise be required to pay in the future. We entered into a tax receivable agreement with the current principals of Silvercrest L.P. and any future employee-holders of Class B units pursuant to which we agreed to pay them 85% of the amount of cash savings, if any, in U.S. federal, state and local income tax that we actually realize as a result of these increases in tax basis and certain other tax benefits related to entering into the tax receivable agreement, including tax benefits attributable to payments thereunder. The timing of these payments is currently unknown. The payments to be made pursuant to the tax receivable agreement will be a liability of Silvercrest and not Silvercrest L.P., and thus this liability has been recorded as an “other liability” on our Consolidated Statement of Financial Condition. For purposes of the tax receivable agreement, cash savings in income tax will be computed by comparing our actual income tax liability to the amount of such taxes that we would have been required to pay had there been no increase in our share of the tax basis of the tangible and intangible assets of Silvercrest L.P.
The actual increase in tax basis, as well as the amount and timing of any payments under the tax receivable agreement, will vary depending upon a number of factors, including the timing of exchanges, the price of shares of our Class A common stock at the time of the exchange, the extent to which such exchanges are taxable, the amount and timing of our income and the tax rates then applicable. Nevertheless, we expect that as a result of the size of the increases in the tax basis of our tangible and intangible assets, the payments that we may make under the tax receivable agreement likely will be substantial. Assuming no material changes in the relevant tax law and that we earn sufficient taxable income to realize the full tax benefit of the increased depreciation and amortization
49
of our assets, we expect that future payments to the selling principals of Silvercrest L.P. in respect of our purchase of Class B units from them will aggregate approximately $15.3 million. Future payments to current principals of Silvercrest L.P. and future holders of Class B units in respect of subsequent exchanges would be in addition to these amounts and are expected to be substantial. We intend to fund required payments pursuant to the tax receivable agreement from the distributions received from Silvercrest L.P.
Cash Flows
The following table sets forth our cash flows for the years ended December 31, 2013, 2012 and 2011. Operating activities consist of net income subject to adjustments for changes in operating assets and liabilities, depreciation, and equity-based compensation expense. Investing activities consist primarily of acquiring and selling property and equipment, distributions received from investments in investment funds, and cash paid as part of business acquisitions. Financing activities consist primarily of contributions from partners, distributions to partners, the issuance and payments on partner notes, other financings, and earnout payments related to business acquisitions.
|
|
Years Ended December 31, |
|
|||||||||
(in thousands) |
|
2013 |
|
|
2012 |
|
|
2011 |
|
|||
Net cash provided by operating activities |
|
$ |
26,387 |
|
|
$ |
20,756 |
|
|
$ |
15,401 |
|
Net cash used in by investing activities |
|
|
(3,479) |
|
|
|
(770 |
) |
|
|
(4,476 |
) |
Net cash used in financing activities |
|
|
(9,229) |
|
|
|
(13,897 |
) |
|
|
(10,596 |
) |
Net change in cash |
|
$ |
13,679 |
|
|
$ |
6,089 |
|
|
$ |
329 |
|
Operating Activities
Year Ended December 31, 2013 versus Year Ended December 31, 2012
Operating activities provided $26.4 million and $20.8 million for years ended December 31, 2013 and 2012, respectively. This difference is partially the result of increased distributions from investment funds of $0.9 million for the same period. Our working capital increased by approximately $3.7 million primarily as a result of increased revenue and increased accrued compensation due to the recognition of partner incentive payment compensation expense beginning in the third quarter.
Year Ended December 31, 2012 versus Year Ended December 31, 2011
Operating activities provided $20.8 million and $15.4 million for the years ended December 31, 2012 and 2011, respectively. This difference primarily is the result of an increase in net income of $5.1 million for the year ended December 31, 2012, and increased working capital resulting from an increase in the change to accrued compensation of $0.8 million due to increased incentive compensation expense in 2012 which was paid in 2013.
Investing Activities
Year Ended December 31, 2013 versus Year Ended December 31, 2012
For the years ended December 31, 2013 and 2012, investing activities used $3.5 million and $0.8 million, respectively. The increase in the use of cash was primarily the result of $2.5 million of cash paid at the closing of the Ten-Sixty Asset Management LLC acquisition in addition to higher earnout payments made related to the Marathon Capital Group, LLC or Marathon acquisition.
Year Ended December 31, 2012 versus Year Ended December 31, 2011
For the year ended December 31, 2012, investing activities used $0.8 million primarily as a result of a $0.7 million earnout payment related to the Marathon acquisition.
50
Financing Activities
Year Ended December 31, 2013 versus Year Ended December 31, 2012
For the years ended December 31, 2013 and 2012, financing activities used $9.2 million and $13.9 million, respectively. The decrease in net cash used in financing activities from 2012 to 2013 was primarily the result of the sale and issuance of Silvercrest Class A common stock of $56.7 million and borrowings under our credit facility of $7.0 million. This was partially offset by the purchase of Class B units from partners of Silvercrest L.P. of $35.4 million, payments under our revolving credit facility of $4.0 million, a decrease in payments from partners on notes receivable as compared to prior year due to note repayments in September 2012, higher partner incentive allocations paid in 2013, and higher tax distributions paid during the year ended December 31, 2013 as compared to the same period in 2012. Incentive allocations and tax distributions increased directly as a result of increased profitability and operating cash flow. Also, the earnout payment made in the first half of 2013 was $0.5 million higher than the payment made in the same period in the prior year and offering expenses related to our initial public offering of $1.5 million were paid as of the end of our reporting period.
Year Ended December 31, 2012 versus Year Ended December 31, 2011
For the years ended December 31, 2012 and 2011, financing activities used $13.9 million and $10.6 million, respectively. The increase in net cash used in financing activities from 2011 to 2012 was primarily the result of higher partner incentive allocations paid in 2012 in addition to higher tax distributions paid during the year ended December 31, 2012 as compared to the same period in 2011 partially offset by increased payments from partners on notes receivable. Incentive allocations and tax distributions increased directly as a result of increased profitability and operating cash flow.
We anticipate that distributions to principals of Silvercrest L.P. will continue to be a material use of our cash resources, and will vary in amount and timing based on our operating results and dividend policy.
As described below, we have outstanding fixed rate notes payable to Ten-Sixty Asset Management LLC and Milbank related to the Ten-Sixty Asset Management LLC and Milbank acquisitions, and variable rate notes issued to former principals to redeem units held by them under which we exercised our call right upon their termination. Furthermore, we have an outstanding balance of $3.0 million on our revolving credit facility.
As of December 31, 2013, the aggregate principal amount of the Ten-Sixty Asset Management LLC promissory note is approximately $1.1 million which is payable in quarterly installments from June 30, 2014 through March 31, 2017 of $0.1 million each. The principal amount outstanding under this note bears interest at the rate of 5% per annum. There was no accrued but unpaid interest on the notes payable related to the Ten-Sixty Asset Management LLC acquisition as of December 31, 2013.
The aggregate principal amount of the notes related to the Milbank acquisition matures after four annual principal installments payable on each of November 1, 2013, 2014, and 2015 in the amounts of $0.9 million, $1.0 million, and $0.6 million, respectively, together with all accrued and unpaid interest. If specified conditions are not met by Milbank prior to November 1, 2014, then the principal payment due on November 1, 2015 will be reduced to $0.1 million. The principal amount outstanding under this note bears interest at the rate of 5% per annum.
As of December 31, 2013, $1.5 million remained outstanding on the notes payable related to the Milbank acquisition. Accrued but unpaid interest on the notes payable related to the Milbank acquisition was approximately $13 thousand as of December 31, 2013.
As of December 31, 2012, $2.4 million remained outstanding on the notes payable related to the Milbank acquisition. Accrued but unpaid interest on the notes payable related to the Milbank acquisition was approximately $20 thousand as of December 31, 2012.
As of December 31, 2013, $3.0 million in borrowings was outstanding on our revolving credit facility with City National Bank.
On June 3, 2013, we redeemed units from two of our former principals. In conjunction with the redemption, we issued promissory notes with an aggregate principal amount of approximately $5.3 million, and such principal amount is subject to downward adjustment to the extent of any breach by the holder of such note. The principal amount of the notes are payable in four equal annual installments on each of June 3, 2014, 2015, 2016 and 2017. The principal amount outstanding under these notes bears interest at the U.S. Prime Rate plus 1% in effect at the time payments are due.
As of December 31, 2013, $5.6 million remained outstanding on the notes issued to former principals. Accrued but unpaid interest on these notes issued to former principals was approximately $139 thousand as of December 31, 2013. The principal amounts outstanding under these notes bear interest at the U.S. Prime Rate plus 1% in effect at the time payments are due.
51
As of December 31, 2012, $0.9 million remained outstanding on the notes issued to former principals. Accrued but unpaid interest on these notes issued to former principals was approximately $26 thousand as of December 31, 2012. The principal amounts outstanding under these notes bear interest at the U.S. Prime Rate plus 1% in effect at the time payments are due.
Contractual Obligations
The following table sets forth information regarding our consolidated contractual obligations as of December 31, 2013.
|
|
Payments Due by Period |
|
|||||||||||||||||
|
|
Less Than |
|
|
More Than |
|
||||||||||||||
|
|
Total |
|
|
1 Year |
|
|
1-3 Years |
|
|
3-5 Years |
|
|
5 Years |
|
|||||
|
|
(in thousands) |
|
|||||||||||||||||
Operating leases |
|
$ |
13,677 |
|
|
$ |
3,675 |
|
|
$ |
7,222 |
|
|
$ |
2,780 |
|
|
$ |
— |
|
Capital leases |
|
|
19 |
|
|
|
19 |
|
|
|
— |
|
|
|
— |
|
|
|
— |
|
Tax receivable agreement (1) |
|
|
15,271 |
|
|
|
142 |
|
|
|
1,351 |
|
|
|
1,461 |
|
|
|
12,317 |
|
Borrowings under revolving credit facility |
|
|
3,000 |
|
|
|
3,000 |
|
|
|
— |
|
|
|
— |
|
|
|
— |
|
Notes payable |
|
|
8,151 |
|
|
|
2,619 |
|
|
|
4,065 |
|
|
|
1,467 |
|
|
|
— |
|
Total |
|
$ |
40,118 |
|
|
$ |
9,455 |
|
|
$ |
12,638 |
|
|
$ |
5,708 |
|
|
$ |
12,317 |
|
(1) | The estimated payments under the tax receivable agreement as of December 31, 2013 are described above under “Liquidity and Capital Resources”. However, amounts payable under the tax receivable agreement will increase upon exchanges of Class B units for our Class A common stock, with the increase representing 85% of the estimated future tax benefits, if any, resulting from the exchanges. The actual amount and timing of payments associated with our existing payable under our tax receivable agreements or future exchanges, and associated tax benefits, will vary depending upon a number of factors as described under “Liquidity and Capital Resources.” |
Off-Balance Sheet Arrangements
We did not have any off-balance sheet arrangements as of December 31, 2013 or December 31, 2012.
Critical Accounting Policies and Estimates
The preparation of the consolidated financial statements requires management to make estimates and assumptions that affect the reported amounts of assets and liabilities, the disclosure of contingent assets and liabilities at the date of the consolidated financial statements and the reported amounts of revenues, expenses and other income reported in the consolidated financial statements and the accompanying notes. We base our estimates on historical experience and on various other assumptions that are believed to be reasonable under current circumstances, our results of which form the basis for making judgments about the carrying value of assets and liabilities that are not readily available from other sources. Actual results could differ from those estimates. Significant estimates and assumptions made by management include the fair value of acquired assets and liabilities, impairment of goodwill and intangible assets, revenue recognition, equity based compensation, accounting for income taxes, and other matters that affect the consolidated financial statements and related disclosures. Accounting policies are an integral part of our financial statements. An understanding of these accounting policies is essential when reviewing our reported results of operations and our financial condition. Management believes that the critical accounting policies and estimates discussed below involve additional management judgment due to the sensitivity of the methods and assumptions used.
Business Combinations
We account for business combinations using the acquisition method of accounting. The acquisition method of accounting requires that purchase price, including the fair value of contingent consideration, of the acquisition be allocated to the assets acquired and liabilities assumed using the estimated fair values determined by management as of the acquisition date.
For acquisitions completed subsequent to January 1, 2009, we measure the fair value of contingent consideration at each reporting period using a probability-adjusted discounted cash flow method based on significant inputs not observable in the market and any change in the fair value from either the passage of time or events occurring after the acquisition date, is recorded in earnings. In relation to our acquisition of Milbank, the fair value of the contingent consideration was based on discounted cash flow models using projected EBITDA for each earnout period. The discount rate applied to the projected EBITDA was determined based on the weighted average cost of capital for the Company and considered that the overall risk associated with the payments was similar to the overall risks of our business as there is no target, floor or cap associated with the contingent payments.
52
Goodwill and Intangible Assets
Goodwill consists of the excess of the purchase price over the fair value of identifiable net assets of businesses acquired. Goodwill is not amortized and is generally evaluated for impairment using a two-step process that is performed at least annually, or whenever events or circumstances indicate that impairment may have occurred.
In September 2011, the FASB issued ASU 2011-08, “Testing Goodwill for Impairment”, which provided new accounting guidance on testing goodwill for impairment. The enhanced guidance provides an entity the option to first perform a qualitative assessment of whether a reporting unit’s fair value is more likely than not less than its carrying value, including goodwill. In performing its qualitative assessment, an entity considers the extent to which adverse events or circumstances identified, such as changes in economic conditions, industry and market conditions or entity specific events, could affect the comparison of the reporting unit’s fair value with its carrying amount. If an entity concludes that the fair value of a reporting unit is more likely than not less than its carrying amount, the entity is required to perform the currently prescribed two-step goodwill impairment test to identify potential goodwill impairment and, accordingly, measure the amount, if any, of goodwill impairment loss to be recognized for that reporting unit. The guidance was effective for us as of January 1, 2012. We utilized this option when performing our annual impairment assessment in 2013 and concluded that our single reporting unit’s fair value was more likely than not greater than its carrying value, including goodwill.
Revenue Recognition
Investment advisory fees are typically billed quarterly in advance at the beginning of the quarter or in arrears after the end of the quarter, based on a contractual percentage of the assets managed. Family office services fees are also typically billed quarterly in advance at the beginning of the quarter or in arrears after the end of the quarter based on a contractual percentage of the assets managed or upon a contractually agreed-upon flat fee arrangement. Revenue is recognized on a ratable basis over the period in which services are performed.
We account for performance-based revenue in accordance with ASC 605-20-S99, Accounting for Management Fees Based on a Formula, by recognizing performance fees and allocations as revenue only when it is certain that the fee income is earned and payable pursuant to the relevant agreements. In certain arrangements, we are only entitled to receive performance fees and allocations when the return on assets under management exceeds certain benchmark returns or other performance targets. We record performance fees and allocations as a component of revenue.
Because the majority of our revenues are earned based on assets under management that have been determined using fair value methods and since market appreciation/depreciation has a significant impact on our revenue, we have presented our assets under management using the GAAP framework for measuring fair value. That framework provides a three-level fair value hierarchy that prioritizes the inputs to valuation techniques used to measure fair value. The hierarchy gives the highest priority to unadjusted quoted prices in active markets for identical assets or liabilities (Level 1) and the lowest priority to unobservable inputs based on company assumptions (Level 3). A financial instrument’s categorization within the fair value hierarchy is based upon the lowest level of input that is significant to the instrument’s fair value measurement. The three levels within the fair value hierarchy are described as follows:
— | Level 1—includes quoted prices (unadjusted) in active markets for identical instruments at the measurement date. The types of financial instruments included in Level 1 include unrestricted securities, including equities listed in active markets. |
— | Level 2—includes inputs other than quoted prices that are observable for the instruments, including quoted prices for similar instruments in active markets, quoted prices for identical or similar instruments in markets that are not active, or inputs other than quoted prices that are observable for the instruments. The type of financial instruments in this category include less liquid and restricted securities listed in active markets, securities traded in other than active markets, government and agency securities, and managed funds whose net asset value is based on observable inputs. |
— | Level 3—includes one or more significant unobservable inputs. Financial instruments that are included in this category include assets under management primarily comprised of investments in privately-held entities, limited partnerships, and other instruments where the fair value is based on unobservable inputs. |
The table below summarizes the approximate amount of assets under management for the periods indicated for which fair value is measured based on Level 1, Level 2 and Level 3 inputs.
53
|
|
Level 1 |
|
|
Level 2 |
|
|
Level 3 |
|
|
Total |
|
||||
|
|
(in billions) |
|
|||||||||||||
December 31, 2013 AUM |
|
$ |
10.5 |
|
|
$ |
2.9 |
|
|
$ |
2.3 |
|
|
$ |
15.7 |
|
December 31, 2012 AUM |
|
$ |
8.4 |
|
|
$ |
1.4 |
|
|
$ |
1.4 |
|
|
$ |
11.2 |
|
As substantially all our assets under management are valued by independent pricing services based upon observable market prices or inputs, we believe market risk is the most significant risk underlying valuation of our assets under management, as discussed under the heading “Risk Factors” in this annual report.
The average value of our assets under management for the year ended December 31, 2013 was approximately $13.5 billion. Assuming a 10% increase or decrease in our average assets under management and the change being proportionately distributed over all our products, the value would increase or decrease by approximately $1.4 billion for the year ended December 31, 2013, which would cause an annualized increase or decrease in revenues of approximately $5.9 million for the year ended December 31, 2013, at a weighted average fee rate for the year ended December 31, 2013 of 0.44%.
The average value of our assets under management for the year ended December 31, 2012 was approximately $10.7 billion. Assuming a 10% increase or decrease in our average assets under management and the change being proportionately distributed over all our products, the value would increase or decrease by approximately $1.1 billion, which would cause an annualized increase or decrease in revenues of approximately $4.6 million, at the 2012 weighted average fee rate of 0.43%.
Equity-Based Compensation
Equity-based compensation cost relating to the issuance of share-based awards to principals is based on the fair value of the award at the date of grant, which is expensed ratably over the requisite service period, net of estimated forfeitures. Prior to our initial public offering, the fair value of the award was based upon the calculation of a per unit limited partnership interest of Silvercrest L.P. company utilizing both discounted cash flow and guideline company valuation methodologies. Subsequent to our initial public offering, the fair value of the award is based upon the per share price of our Class A common stock. The forfeiture assumption is ultimately adjusted to the actual forfeiture rate. Therefore, changes in the forfeiture assumptions may affect the timing of the total amount of expense recognized over the vesting period. The service period is the period over which the employee performs the related services, which is normally the same as the vesting period. Equity-based awards that do not require future service are expensed immediately. Equity-based awards that have the potential to be settled in cash at the election of the employee are classified as liabilities, or Liability Awards, and are adjusted to fair value at the end of each reporting period. Distributions associated with Liability Awards not expected to vest are accounted for as part of compensation expense in our Consolidated Statements of Operations.
In order to determine the fair value of our limited partnership interests underlying equity-based compensation awards issued prior to our initial public the offering, we first determined the market value of our invested capital, or MVIC. Our MVIC was estimated using a combination of two generally accepted approaches: the income approach using the discounted cash flow method, or DCF, and the market-based approach using the comparable company method. The DCF method estimates enterprise value based on the estimated present value of future net cash flows the business is expected to generate over a forecasted period and an estimate of the present value of cash flows beyond that period, which is referred to as terminal value. The estimated present value is calculated using our weighted average cost of capital, which accounts for the time value of money and the appropriate degree of risks inherent in the business. The market-based approach considers multiples of financial metrics based trading multiples of a selected peer group of companies. These multiples are then applied to our financial metrics to derive a range of indicated values. Once calculated, the discounted cash flow and comparable company methods are then weighted. Estimates of the volatility of our limited partnership interests were based on available information regarding the volatility of common stock of comparable, publicly traded companies.
Prior to our initial public offering, the fair value of the limited partnership interests underlying equity-based compensation awards were determined in accordance with the guidelines outlined in the American Institute of Certified Public Accountants Practice Aid, “Valuation of Privately-Held-Company Equity Securities Issued as Compensation.” The assumptions we used in the valuation model were based on future expectations combined with management judgment. Because there had been no public market for our limited partnership units, management exercised significant judgment and considered numerous objective and subjective factors to determine the fair value of our limited partnership interests as of the date of each equity-based compensation award grant, including the following factors:
|
• |
|
the provisions of our limited partnership agreement; |
|
• |
|
our operating and financial performance; |
|
• |
|
current business conditions and projections; |
|
• |
|
lack of control discount; |
|
• |
|
lack of marketability discount; |
|
• |
|
the likelihood of achieving a liquidity event for the limited partnership interests underlying these equity-based compensation awards, such as an initial public offering or sale of our company, given prevailing market conditions; |
54
|
• |
|
historical trading activity of comparable publicly traded companies; |
|
• |
|
the market performance of comparable publicly traded companies; and |
|
• |
|
the U.S. and global capital market conditions. |
In February 2010, we granted 15,808 units with fair value at grant date of $68.36 per unit. By February 2011, U.S. markets improved which resulted in an increase in our valuation and the market value of comparable companies. As a result of these factors in addition to organic growth, we projected increases in our budget for 2011 as compared to our actual performance in 2010. In February 2011, we granted 10,802 units with fair value at grant date of $148.35 per unit. Our valuation determined a MVIC by weighting the DCF approach at 50% and the market-based approach at 50%. Our MVIC reflected a discount for lack of control of 13% based on the existence of a non-managing partnership interest and a discount for lack of marketability of 20% based on a liquidity event expected to occur within approximately twelve months. In February 2012, we granted 1,000 units with fair value at grant date of $207.71 per unit. U.S. markets continued to improve into the first quarter of 2012 as compared to the end of 2011. As a result, we projected increases in our 2012 budget as compared to actual performance in 2011. Our valuation for the February 2012 grants was determined using a market-based approach.
Income Taxes
Silvercrest L.P., our operating company, is not subject to federal and state income taxes, since all income, gains and losses are passed through to its partners. Our operating company is subject to New York City Unincorporated Business Tax. We, including our affiliated incorporated entities, are subject to federal and state corporate income tax, which requires an asset and liability approach to the financial accounting and reporting of income taxes. With respect to our incorporated entities, the annual tax rate is based on the income, statutory tax rates and tax planning opportunities available in the various jurisdictions in which we operate. Tax laws are complex and subject to different interpretations by the taxpayer and respective governmental taxing authorities. Judgment is required in determining the tax expense and in evaluating tax positions. The tax effects of an uncertain tax position, or UTP, taken or expected to be taken in income tax returns are recognized only if it is “more likely-than-not” to be sustained on examination by the taxing authorities, based on its technical merits as of the reporting date. The tax benefits recognized in the financial statements from such a position are measured based on the largest benefit that has a greater than 50% likelihood of being realized upon ultimate settlement. We recognize estimated interest and penalties related to UTPs in income tax expense.
We recognize the benefit of a UTP in the period when it is effectively settled. Previously recognized tax positions are derecognized in the first period in which it is no longer more likely than not that the tax position would be sustained upon examination.
Recently Issued Accounting Pronouncements
In June 2013, the FASB issued ASU 2013-08, “Financial Services-Investment Companies (Topic 946): Amendments to the Scope, Measurement, and Disclosure Requirements.” The ASU modifies the guidance in ASC 946 for determining whether an entity is an investment company, as well as the measurement and disclosure requirements for investment companies. The ASU also clarifies the characteristics of an investment company and requires an investment company to measure noncontrolling ownership interests in other investment companies at fair value rather than using the equity method of accounting. The ASU does not change the current accounting where a noninvestment company parent retains the specialized accounting applied by an investment company subsidiary in consolidation. The ASU is effective for the fiscal years and interim periods beginning after December 15, 2013. This ASU is not expected to have a material effect on the Company’s results of operations or financial position.
Item 7A. Qualitative and Quantitative Disclosures Regarding Market Risk
Our exposure to market risk is directly related to our role as investment adviser for the separate accounts we manage and the funds for which we act as sub-investment adviser. Most of our revenue for the years ended December 31, 2013, 2012 and 2011 was derived from advisory fees, which are typically based on the market value of assets under management. Accordingly, a decline in the prices of securities would cause our revenue and income to decline due to a decrease in the value of the assets we manage. In addition, such a decline could cause our clients to withdraw their funds in favor of investments offering higher returns or lower risk, which would cause our revenue and income to decline further. Due to the nature of our business, we believe that we do not face any material risk from inflation. Please see our discussion of market risks in “—Critical Accounting Policies and Estimates—Revenue Recognition” which is part of Item 7. “Management’s Discussion and Analysis of Financial Condition and Results of Operations.”
Item 8. Financial Statements and Supplementary Data.
See “Index to Financial Statements” which appears on page F-1 of this report.
55
Item 9A. Controls and Procedures
Disclosure Controls and Procedures
Our management, including our Chief Executive Officer and Chief Financial Officer, evaluated the effectiveness of our disclosure controls and procedures (as such term is defined in Rules 13a-15(e) and 15d-15(e) under the Exchange Act of 1934, as amended) at December 31, 2013. Based on this evaluation, our Chief Executive Officer and Chief Financial Officer have concluded that our disclosure controls and procedures were effective at December 31, 2013.
Internal Control over Financial Reporting
There were no changes in the Company’s internal control over financial reporting that occurred during the quarter ended December 31, 2013 that have materially affected or are reasonably likely to materially affect our internal control over financial reporting.
This annual report does not include a report of management’s assessment regarding internal control over financial reporting or an attestation report of our registered public accounting firm due to a transition period established by SEC rules for newly public companies.
56
Item 10. Directors, Executive Officers and Corporate Governance
Information required by this item will be included in our definitive Proxy Statement for our 2014 Annual Meeting of Stockholders, which will be filed within 120 days of the end of our fiscal year ended December 31, 2013 (“2014 Proxy Statement”) and is incorporated herein by reference.
Item 11. Executive Compensation
Information required by this item will be included in the 2014 Proxy Statement and is incorporated herein by reference.
Item 12. Security Ownership of Certain Beneficial Owners and Management and Related Stockholder Matters
Information required by this item will be included in the 2014 Proxy Statement and is incorporated herein by reference.
Item 13. Certain Relationships and Related Transactions, and Director Independence
Information required by this item will be included in the 2014 Proxy Statement and is incorporated herein by reference.
Item 14. Principal Accounting Fees and Services
Information required by this item will be included in the 2014 Proxy Statement and is incorporated herein by reference.
57
Item 15. Exhibits, Financial Statement Schedules.
(a) | The following documents are filed as part of this Annual Report on Form 10-K: |
(1) | Financial Statements |
(i) | Consolidated Statements of Financial Condition as of December 31, 2013 and 2012 |
(ii) | Consolidated Statements of Operations for the years ended December 31, 2013, 2012 and 2011 |
(iii) | Consolidated Statements of Stockholders’ Equity/Partners’ Deficit for the years ended December 31, 2013, 2012 and 2011 |
(iv) | Consolidated Statements of Cash Flows for the years ended December 31, 2013, 2012 and 2011 |
(v) | Notes to Consolidated Financial Statements |
(2) | Financial Statement Schedules |
There are no Financial Statement Schedules filed as part of this Annual Report on 10-K, as the required information is not applicable.
(b) Exhibit Index:
Exhibit |
|
Description |
3.1* |
|
Second Amended and Restated Certificate of Incorporation of Silvercrest Asset Management Group Inc. (incorporated by reference to Exhibit 3.1 to the Registrant’s Registration Statement on Form S-1 filed April 19, 2013). |
|
|
|
3.2* |
|
Bylaws of Silvercrest Asset Management Group Inc. (incorporated by reference to Exhibit 3.2 to the Registrant’s Registration Statement on Form S-1 filed April 19, 2013). |
|
|
|
4.1* |
|
Specimen Stock Certificate for Shares of Class A Common Stock (incorporated by reference to Exhibit 4.1 to the Registrant’s Registration Statement on Form S-1 filed April 19, 2013). |
|
|
|
4.2* |
|
Exchange Agreement (incorporated by reference to Exhibit 4.2 to the Registrant’s Registration Statement on Form S-1 filed April 19, 2013). |
4.3* |
|
Resale and Registration Rights Agreement (incorporated by reference to Exhibit 4.3 to the Registrant’s Registration Statement on Form S-1 filed April 19, 2013). |
|
|
|
4.4* |
|
2012 Equity Incentive Plan (incorporated by reference to Exhibit 4.4 to the Registrant’s Registration Statement on Form S-1 filed April 19, 2013).
|
4.6* |
|
Form of February 2010 Deferred Equity Unit Award Agreement (incorporated by reference to Exhibit 4.6 to the Registrant’s Registration Statement on Form S-1 filed April 19, 2013). |
|
|
|
10.1* |
|
Form of Second Amended and Restated Limited Partnership Agreement of Silvercrest L.P. (incorporated by reference to Exhibit 10.1 to the Registrant’s Registration Statement on Form S-1 filed April 19, 2013). |
|
|
|
10.2* |
|
Tax Receivable Agreement (incorporated by reference to Exhibit 10.2 to the Registrant’s Registration Statement on Form S-1 filed April 19, 2013). |
|
|
|
10.3* |
|
Form of Indemnification Agreement with Directors (incorporated by reference to Exhibit 10.3 to the Registrant’s Registration Statement on Form S-1 filed April 19, 2013). |
|
|
|
10.5* |
|
Credit agreement (incorporated by reference to Exhibit 10.5 to the Registrant’s Registration Statement on Form S-1 filed June 25, 2013). |
|
|
|
23.1** |
|
Consent of Deloitte & Touche LLP |
|
|
|
31.1** |
|
Certification of the Company’s Chief Executive Officer pursuant to Exchange Act Rules 13a-14(a)/15d-14(a), as adopted pursuant to Section 302 of the Sarbanes-Oxley Act of 2002. |
|
|
|
58
Exhibit |
|
Description |
31.2** |
|
Certification of the Company’s Chief Financial Officer pursuant to Exchange Act Rules 13a-14(a)/15d-14(a), as adopted pursuant to Section 302 of the Sarbanes-Oxley Act of 2002. |
|
|
|
32.1** |
|
Certification of the Company’s Chief Executive Officer pursuant to 18 U.S.C. Section 1350, as adopted pursuant to Section 906 of the Sarbanes-Oxley Act of 2002. |
|
|
|
32.2** |
|
Certification of the Company’s Chief Financial Officer pursuant to 18 U.S.C. Section 1350, as adopted pursuant to Section 906 of the Sarbanes-Oxley Act of 2002. |
|
|
|
101.INS** |
|
XBRL Instance Document |
|
|
|
101.SCH** |
|
XBRL Taxonomy Extension Schema Document |
|
|
|
101.CAL** |
|
XBRL Taxonomy Extension Calculation Linkbase Document |
|
|
|
101.LAB** |
|
XBRL Taxonomy Extension Label Linkbase Document |
|
|
|
101.PRE** |
|
XBRL Taxonomy Extension Presentation Linkbase Document |
|
|
|
101.DEF** |
|
XBRL Taxonomy Extension Definition Linkbase Document |
* | Previously filed |
** | Furnished herewith |
Pursuant to Rule 406T of Regulation S-T, the interactive data files on Exhibit 101 hereto are deemed not filed or part of a registration statement or prospectus for purposes of Sections 11 and 12 of the Securities Act of 1933, as amended, are deemed not filed for purposes of Section 18 of the Securities Exchange Act of 1934, as amended, and otherwise are not subject to liability under those sections.
59
SIGNATURES
Pursuant to the requirements of Section 13 or 15(d) of the Securities Exchange Act of 1934, the Registrant has duly caused this report to be signed on its behalf by the undersigned, thereunto duly authorized, in the city of New York, state of New York on March 20, 2014.
SILVERCREST ASSET MANAGEMENT GROUP INC. |
||
|
|
|
By: |
|
/s/ Richard R. Hough III |
|
|
Richard R. Hough III |
|
|
Chief Executive Officer and President |
|
|
|
By: |
|
/s/ Scott A. Gerard |
|
|
Scott A. Gerard |
|
|
Chief Financial Officer |
Pursuant to the requirements of the Securities Exchange Act of 1934, this report has been signed by the following persons on behalf of the Registrant and in the capacities indicated on the 20th day of March, 2014:
Signature |
|
Title |
|
Date |
|
|
|
|
|
/s/ Richard R. Hough III |
|
|
|
|
Richard R. Hough III |
|
(Principal Executive Officer) and Director |
|
March 20, 2014 |
|
|
|
|
|
/s/ Scott A. Gerard |
|
|
|
|
Scott A. Gerard |
|
(Principal Financial and Accounting Officer) |
|
March 20, 2014 |
|
|
|
|
|
/s/ Winthrop B. Conrad, Jr. |
|
|
|
|
Winthrop B. Conrad, Jr. |
|
Director |
|
March 20, 2014 |
|
|
|
|
|
/s/ Wilmot H. Kidd III |
|
|
|
|
Wilmot H. Kidd III |
|
Director |
|
March 20, 2014 |
|
|
|
|
|
/s/ Richard S. Pechter |
|
|
|
|
Richard S. Pechter |
|
Director |
|
March 20, 2014 |
60
INDEX TO CONSOLIDATED FINANCIAL STATEMENTS
Silvercrest Asset Management Group, Inc. |
|
|
|
|
|
|
|
|
F– |
2 |
|
|
|
|
|
Consolidated Statements of Financial Condition as of December 31, 2013 and December 31, 2012 |
|
F– |
3 |
|
|
|
|
Condensed Consolidated Statements of Operations for the years ended December 31, 2013, 2012 and 2011 |
|
F– |
4 |
|
|
|
|
|
F– |
5 |
|
|
|
|
|
Consolidated Statements of Cash Flows for the years ended December 31, 2013, 2012 and 2011 |
|
F– |
6 |
|
|
|
|
|
F– |
8 |
F-1
REPORT OF INDEPENDENT REGISTERED PUBLIC ACCOUNTING FIRM
To the Stockholders of Silvercrest Asset Management Group Inc.:
We have audited the accompanying consolidated statements of financial condition of Silvercrest Asset Management Group Inc. and Subsidiaries (the “Company”) as of December 2013 and 2012, and the related consolidated statements of operations, changes in stockholders’ equity/partners’ deficit, and cash flows for each of the three years in the period ended December 31, 2013. These consolidated financial statements are the responsibility of the Company’s management. Our responsibility is to express an opinion on these consolidated financial statements based on our audits.
We conducted our audits in accordance with the standards of the Public Company Accounting Oversight Board (United States). Those standards require that we plan and perform the audit to obtain reasonable assurance about whether the consolidated financial statements are free of material misstatement. The Company is not required to have, nor were we engaged to perform, an audit of its internal control over financial reporting. Our audits included consideration of internal control over financial reporting as a basis for designing audit procedures that are appropriate in the circumstances, but not for the purpose of expressing an opinion on the effectiveness of the Company’s internal control over financial reporting. Accordingly, we express no such opinion. An audit also includes examining, on a test basis, evidence supporting the amounts and disclosures in the consolidated financial statements, assessing the accounting principles used and significant estimates made by management, as well as evaluating the overall consolidated financial statement presentation. We believe that our audits provide a reasonable basis for our opinion.
In our opinion, such consolidated financial statements present fairly, in all material respects, the consolidated financial position of Silvercrest Asset Management Group Inc. and Subsidiaries as of December 31, 2013 and 2012 and the results of their operations and their cash flows for each of the three years in the period ended December 31, 2013, in conformity with accounting principles generally accepted in the United States of America.
As discussed in Note 1 to the consolidated financial statements, effective June 26, 2013, the Company completed an initial public offering of 4,790,684 shares of its Class A common stock and, pursuant to a reorganization agreement, became the general partner of Silvercrest L.P., the Company’s accounting predecessor.
/s/ DELOITTE & TOUCHE LLP
New York, New York |
|
March 20, 2014
F-2
Silvercrest Asset Management Group Inc.
Consolidated Statements of Financial Condition
(In thousands)
|
|
December 31, |
|
|
December 31, |
|
||
Assets |
|
|
|
|
|
|
|
|
Cash and cash equivalents |
|
$ |
27,122 |
|
|
$ |
13,443 |
|
Restricted certificates of deposit and escrow |
|
|
1,021 |
|
|
|
1,020 |
|
Investments |
|
|
103 |
|
|
|
1,980 |
|
Receivables, net |
|
|
5,405 |
|
|
|
3,675 |
|
Due from Silvercrest Funds |
|
|
2,653 |
|
|
|
1,622 |
|
Furniture, equipment and leasehold improvements, net |
|
|
1,913 |
|
|
|
2,061 |
|
Goodwill |
|
|
20,031 |
|
|
|
15,891 |
|
Intangible assets, net |
|
|
12,589 |
|
|
|
12,363 |
|
Deferred tax asset—tax receivable agreement |
|
|
25,022 |
|
|
|
— |
|
Prepaid expenses and other assets |
|
|
4,868 |
|
|
|
399 |
|
Total assets |
|
$ |
100,727 |
|
|
$ |
52,454 |
|
Liabilities, Redeemable Partners’ Capital and Stockholders’ Equity/Partners’ Deficit |
|
|
|
|
|
|
|
|
Accounts payable and accrued expenses |
|
$ |
6,587 |
|
|
$ |
4,513 |
|
Accrued compensation |
|
|
17,424 |
|
|
|
3,656 |
|
Notes payable |
|
|
8,303 |
|
|
|
3,315 |
|
Borrowings under revolving credit facility |
|
|
3,000 |
|
|
|
— |
|
Deferred rent |
|
|
1,742 |
|
|
|
2,268 |
|
Deferred tax and other liabilities |
|
|
15,506 |
|
|
|
565 |
|
Total liabilities |
|
|
52,562 |
|
|
|
14,317 |
|
Redeemable partners’ capital |
|
|
— |
|
|
|
102,017 |
|
Notes receivable from partners |
|
|
— |
|
|
|
(3,410) |
|
Total redeemable partners’ capital |
|
|
— |
|
|
|
98,607 |
|
Commitments and Contingencies (Note 10) |
|
|
|
|
|
|
|
|
Stockholders’ Equity/Partners’ Deficit |
|
|
|
|
|
|
|
|
Preferred Stock, par value $0.01, 10,000,000 shares authorized; none issued and outstanding |
|
|
— |
|
|
|
— |
|
Class A Common Stock, par value $0.01, 50,000,000 shares authorized; 7,522,974 issued and outstanding |
|
|
75 |
|
|
|
— |
|
Class B Common Stock, par value $0.01, 25,000,000 shares authorized; 4,464,617 issued and outstanding |
|
|
45 |
|
|
|
— |
|
Additional Paid-In Capital |
|
|
39,003 |
|
|
|
— |
|
Retained earnings |
|
|
2,099 |
|
|
|
— |
|
Partners’ capital |
|
|
— |
|
|
|
47,904 |
|
Excess of liabilities, redeemable partners’ capital and partners’ capital over assets |
|
|
— |
|
|
|
(108,374 |
) |
Total stockholders’ equity/partners’ deficit |
|
|
41,222 |
|
|
|
(60,470 |
) |
Non-controlling interests |
|
|
6,943 |
|
|
|
— |
|
Total equity/partners’ deficit |
|
|
48,165 |
|
|
|
(60,470 |
) |
Total liabilities, redeemable partners’ capital and stockholders’ equity/partners’ deficit |
|
$ |
100,727 |
|
|
$ |
52,454 |
|
See accompanying notes to consolidated financial statements.
F-3
Silvercrest Asset Management Group Inc.
Consolidated Statements of Operations
(In thousands)
|
|
For the year ended December 31, |
|
|||||||||
|
|
2013 |
|
|
2012 |
|
|
2011 |
|
|||
Revenue |
|
|
|
|
|
|
|
|
|
|
|
|
Management and advisory fees |
|
$ |
53,465 |
|
|
$ |
46,069 |
|
|
$ |
37,869 |
|
Performance fees and allocations |
|
|
1,830 |
|
|
|
714 |
|
|
|
85 |
|
Family office services |
|
|
4,756 |
|
|
|
4,907 |
|
|
|
4,833 |
|
Total revenue |
|
|
60,051 |
|
|
|
51,690 |
|
|
|
42,787 |
|
Expenses |
|
|
|
|
|
|
|
|
|
|
|
|
Compensation and benefits |
|
|
30,322 |
|
|
|
19,108 |
|
|
|
17,492 |
|
General and administrative |
|
|
13,197 |
|
|
|
13,680 |
|
|
|
10,849 |
|
Total expenses |
|
|
43,519 |
|
|
|
32,788 |
|
|
|
28,341 |
|
Income before other income (expense), net |
|
|
16,532 |
|
|
|
18,902 |
|
|
|
14,446 |
|
Other income (expense), net |
|
|
|
|
|
|
|
|
|
|
|
|
Loss on forgiveness of notes receivable |
|
|
— |
|
|
|
— |
|
|
|
(34 |
) |
Other income (expense), net |
|
|
3,118 |
|
|
|
123 |
|
|
|
(210 |
) |
Interest income |
|
|
92 |
|
|
|
145 |
|
|
|
187 |
|
Interest expense |
|
|
(447 |
) |
|
|
(304 |
) |
|
|
(164 |
) |
Equity income from investments |
|
|
21 |
|
|
|
1,911 |
|
|
|
950 |
|
Total other income (expense), net |
|
|
2,784 |
|
|
|
1,875 |
|
|
|
729 |
|
Income before provision for income taxes |
|
|
19,316 |
|
|
|
20,777 |
|
|
|
15,175 |
|
Provision for income taxes |
|
|
(2,148 |
) |
|
|
(1,057 |
) |
|
|
(566 |
) |
Net income |
|
|
17,168 |
|
|
$ |
19,720 |
|
|
$ |
14,609 |
|
Less: net income attributable to non-controlling interests |
|
|
(3,478 |
) |
|
|
|
|
|
|
|
|
Net income attributable to Silvercrest |
|
$ |
13,690 |
|
|
|
|
|
|
|
|
|
Net income per share/unit: |
|
|
|
|
|
|
|
|
|
|
|
|
Basic |
|
$ |
1.68 |
|
|
$ |
1.87 |
|
|
$ |
1.46 |
|
Diluted |
|
$ |
1.63 |
|
|
$ |
1.84 |
|
|
$ |
1.40 |
|
Weighted average shares/units outstanding: |
|
|
|
|
|
|
|
|
|
|
|
|
Basic |
|
|
8,145,476 |
|
|
|
10,544,323 |
|
|
|
10,004,227 |
|
Diluted |
|
|
8,374,025 |
|
|
|
10,690,775 |
|
|
|
10,443,317 |
|
See accompanying notes to consolidated financial statements.
F-4
Silvercrest Asset Management Group Inc.
Consolidated Statements of Changes in Stockholder’s Equity/Partners’ Deficit
(In thousands)
|
|
Class A Common Stock Shares |
|
|
Class A Common Stock Amount |
|
|
Class B Common Stock Shares |
|
|
Class B Common Stock Amount |
|
|
Additional Paid-In Capital |
|
|
Retained Earnings |
|
|
Total |
|
|
Non- controlling Interest |
|
|
Total Equity |
|
|
Partners’ Capital |
|
|
Excess of Liabilities, Redeemable Partners’ Capital and Partners’ Capital over Assets |
|
|
Total Partners’ Deficit |
|
||||||||||||
January 1, 2011 |
|
|
— |
|
|
$ |
— |
|
|
|
— |
|
|
$ |
— |
|
|
$ |
— |
|
|
$ |
— |
|
|
$ |
— |
|
|
$ |
— |
|
|
$ |
— |
|
|
$ |
41,909 |
|
|
$ |
(66,939 |
) |
|
$ |
(25,030 |
) |
Contributions from partners |
|
|
— |
|
|
|
— |
|
|
|
— |
|
|
|
— |
|
|
|
— |
|
|
|
— |
|
|
|
— |
|
|
|
— |
|
|
|
— |
|
|
|
— |
|
|
|
849 |
|
|
|
849 |
|
Distributions to partners |
|
|
— |
|
|
|
— |
|
|
|
— |
|
|
|
— |
|
|
|
— |
|
|
|
— |
|
|
|
— |
|
|
|
— |
|
|
|
— |
|
|
|
(1,271 |
) |
|
|
(8,723 |
) |
|
|
(9,994 |
) |
Equity-based compensation |
|
|
— |
|
|
|
— |
|
|
|
— |
|
|
|
— |
|
|
|
— |
|
|
|
— |
|
|
|
— |
|
|
|
— |
|
|
|
— |
|
|
|
— |
|
|
|
489 |
|
|
|
489 |
|
Accretion to redemption value of redeemable partnership units |
|
|
— |
|
|
|
— |
|
|
|
— |
|
|
|
— |
|
|
|
— |
|
|
|
— |
|
|
|
— |
|
|
|
— |
|
|
|
— |
|
|
|
— |
|
|
|
(36,589 |
) |
|
|
(36,589 |
) |
Net Income |
|
|
— |
|
|
|
— |
|
|
|
— |
|
|
|
— |
|
|
|
— |
|
|
|
— |
|
|
|
— |
|
|
|
— |
|
|
|
— |
|
|
|
3,721 |
|
|
|
10,888 |
|
|
|
14,609 |
|
December 31, 2011 |
|
|
— |
|
|
|
— |
|
|
|
— |
|
|
|
— |
|
|
|
— |
|
|
|
— |
|
|
|
— |
|
|
|
— |
|
|
|
— |
|
|
$ |
44,359 |
|
|
$ |
(100,025 |
) |
|
$ |
(55,666 |
) |
Contributions from partners |
|
|
— |
|
|
|
— |
|
|
|
— |
|
|
|
— |
|
|
|
— |
|
|
|
— |
|
|
|
— |
|
|
|
— |
|
|
|
— |
|
|
|
— |
|
|
|
112 |
|
|
|
112 |
|
Distributions to partners |
|
|
— |
|
|
|
— |
|
|
|
— |
|
|
|
— |
|
|
|
— |
|
|
|
— |
|
|
|
— |
|
|
|
— |
|
|
|
— |
|
|
|
(1,466 |
) |
|
|
(13,283 |
) |
|
|
(14,749 |
) |
Equity-based compensation |
|
|
— |
|
|
|
— |
|
|
|
— |
|
|
|
— |
|
|
|
— |
|
|
|
— |
|
|
|
— |
|
|
|
— |
|
|
|
— |
|
|
|
— |
|
|
|
1,019 |
|
|
|
1,019 |
|
Accretion to redemption value of redeemable partnership units |
|
|
— |
|
|
|
— |
|
|
|
— |
|
|
|
— |
|
|
|
— |
|
|
|
— |
|
|
|
— |
|
|
|
— |
|
|
|
— |
|
|
|
— |
|
|
|
(10,906 |
) |
|
|
(10,906 |
) |
Net Income |
|
|
— |
|
|
|
— |
|
|
|
— |
|
|
|
— |
|
|
|
— |
|
|
|
— |
|
|
|
— |
|
|
|
— |
|
|
|
— |
|
|
|
5,011 |
|
|
|
14,709 |
|
|
|
19,720 |
|
December 31, 2012 |
|
|
— |
|
|
$ |
— |
|
|
|
— |
|
|
$ |
— |
|
|
$ |
— |
|
|
$ |
— |
|
|
$ |
— |
|
|
$ |
— |
|
|
$ |
— |
|
|
$ |
47,904 |
|
|
$ |
(108,374 |
) |
|
$ |
(60,470 |
) |
Contributions from partners |
|
|
— |
|
|
|
— |
|
|
|
17 |
|
|
|
— |
|
|
|
— |
|
|
|
— |
|
|
|
— |
|
|
|
165 |
|
|
|
165 |
|
|
|
— |
|
|
|
455 |
|
|
|
455 |
|
Distributions to partners |
|
|
— |
|
|
|
— |
|
|
|
— |
|
|
|
— |
|
|
|
— |
|
|
|
— |
|
|
|
— |
|
|
|
(1,417 |
) |
|
|
(1,417 |
) |
|
|
(4,036 |
) |
|
|
(23,864 |
) |
|
|
(27,900 |
) |
Accrued partner incentive distributions |
|
|
— |
|
|
|
— |
|
|
|
— |
|
|
|
— |
|
|
|
— |
|
|
|
— |
|
|
|
— |
|
|
|
— |
|
|
|
— |
|
|
|
— |
|
|
|
(6,000 |
) |
|
|
(6,000 |
) |
Redemptions of partners’ interests |
|
|
— |
|
|
|
— |
|
|
|
(14 |
) |
|
|
— |
|
|
|
— |
|
|
|
— |
|
|
|
— |
|
|
|
(190 |
) |
|
|
(190 |
) |
|
|
— |
|
|
|
(5,561 |
) |
|
|
(5,561 |
) |
Equity-based compensation |
|
|
— |
|
|
|
— |
|
|
|
16 |
|
|
|
— |
|
|
|
— |
|
|
|
— |
|
|
|
— |
|
|
|
635 |
|
|
|
635 |
|
|
|
— |
|
|
|
1,024 |
|
|
|
1,024 |
|
Reclassification of equity-based awards due to elimination of redemption feature |
|
|
— |
|
|
|
— |
|
|
|
— |
|
|
|
— |
|
|
|
— |
|
|
|
— |
|
|
|
— |
|
|
|
— |
|
|
|
— |
|
|
|
— |
|
|
|
824 |
|
|
|
824 |
|
Net Income |
|
|
— |
|
|
|
— |
|
|
|
— |
|
|
|
— |
|
|
|
— |
|
|
|
2,760 |
|
|
|
2,760 |
|
|
|
3,479 |
|
|
|
6,239 |
|
|
|
2,827 |
|
|
|
8,102 |
|
|
|
10,929 |
|
Issuance of Class A shares in IPO |
|
|
5,509 |
|
|
|
55 |
|
|
|
— |
|
|
|
— |
|
|
|
55,160 |
|
|
|
— |
|
|
|
55,215 |
|
|
|
— |
|
|
|
55,215 |
|
|
|
— |
|
|
|
— |
|
|
|
— |
|
Reorganization of equity structure |
|
|
— |
|
|
|
— |
|
|
|
10,000 |
|
|
|
100 |
|
|
|
— |
|
|
|
— |
|
|
|
100 |
|
|
|
12,683 |
|
|
|
12,783 |
|
|
|
(46,695 |
) |
|
|
133,394 |
|
|
|
86,699 |
|
Purchase of Class B units of SLP |
|
|
— |
|
|
|
— |
|
|
|
(3,541 |
) |
|
|
(35 |
) |
|
|
(30,881 |
) |
|
|
— |
|
|
|
(30,916) |
|
|
|
(4,484 |
) |
|
|
(35,400 |
) |
|
|
— |
|
|
|
— |
|
|
|
— |
|
Accrued interest on notes receivable from partners |
|
|
— |
|
|
|
— |
|
|
|
— |
|
|
|
— |
|
|
|
— |
|
|
|
— |
|
|
|
— |
|
|
|
(30 |
) |
|
|
(30 |
) |
|
|
— |
|
|
|
— |
|
|
|
— |
|
Share Conversion |
|
|
2,013 |
|
|
|
20 |
|
|
|
(2,013) |
|
|
|
(20) |
|
|
|
3,898 |
|
|
|
— |
|
|
|
3,898 |
|
|
|
(3,898 |
) |
|
|
— |
|
|
|
— |
|
|
|
— |
|
|
|
— |
|
Dividends paid on Class A common stock - $0.12 per share |
|
|
— |
|
|
|
— |
|
|
|
— |
|
|
|
— |
|
|
|
— |
|
|
|
(661) |
|
|
|
(661) |
|
|
|
— |
|
|
|
(661) |
|
|
|
— |
|
|
|
— |
|
|
|
— |
|
Initial establishment of deferred tax assets, net of amounts payable under tax receivable agreement |
|
|
— |
|
|
|
— |
|
|
|
— |
|
|
|
— |
|
|
|
10,826 |
|
|
|
— |
|
|
|
10,826 |
|
|
|
— |
|
|
|
10,826 |
|
|
|
— |
|
|
|
— |
|
|
|
— |
|
December 31, 2013 |
|
|
7,522 |
|
|
$ |
75 |
|
|
|
4,465 |
|
|
$ |
45 |
|
|
$ |
39,003 |
|
|
$ |
2,099 |
|
|
$ |
41,222 |
|
|
$ |
6,943 |
|
|
$ |
48,165 |
|
|
$ |
— |
|
|
$ |
— |
|
|
$ |
— |
|
See accompanying notes to consolidated financial statements.
F-5
Silvercrest Asset Management Group Inc.
Consolidated Statements of Cash Flows
(In thousands)
|
|
For the year ended December 31, |
|
|||||||||
|
|
2013 |
|
|
2012 |
|
|
2011 |
|
|||
Cash Flows From Operating Activities |
|
|
|
|
|
|
|
|
|
|
|
|
Net income |
|
$ |
17,168 |
|
|
$ |
19,720 |
|
|
$ |
14,609 |
|
Adjustments to reconcile net income to net cash provided by operating activities: |
|
|
|
|
|
|
|
|
|
|
|
|
Equity-based compensation |
|
|
1,962 |
|
|
|
1,354 |
|
|
|
977 |
|
Depreciation and amortization |
|
|
1,944 |
|
|
|
1,918 |
|
|
|
1,469 |
|
Amortization of acquired deferred revenue |
|
|
— |
|
|
|
— |
|
|
|
(870 |
) |
Deferred rent |
|
|
(448) |
|
|
|
(336 |
) |
|
|
(265 |
) |
Reversal of lease abandonment charge |
|
|
— |
|
|
|
(576 |
) |
|
|
— |
|
Deferred income taxes |
|
|
283 |
|
|
|
22 |
|
|
|
(275 |
) |
Loss on forgiveness of notes receivable |
|
|
— |
|
|
|
— |
|
|
|
34 |
|
Non-cash interest on notes receivable from partners |
|
|
(82) |
|
|
|
(138 |
) |
|
|
(180 |
) |
Distributions received from investment funds |
|
|
1,900 |
|
|
|
965 |
|
|
|
1,231 |
|
Equity income from investments |
|
|
(21) |
|
|
|
(1,911 |
) |
|
|
(950 |
) |
Other |
|
|
— |
|
|
|
(6 |
) |
|
|
— |
|
Cash flows due to changes in operating assets and liabilities: |
|
|
|
|
|
|
|
|
|
|
|
|
Receivables and due from Silvercrest Funds |
|
|
(2,762) |
|
|
|
(1,016 |
) |
|
|
(780 |
) |
Prepaid expenses and other assets |
|
|
(4,532) |
|
|
|
117 |
|
|
|
192 |
|
Accounts payable and accrued expenses |
|
|
1,443 |
|
|
|
(76 |
) |
|
|
644 |
|
Accrued compensation |
|
|
8,485 |
|
|
|
406 |
|
|
|
(360 |
) |
Other liabilities |
|
|
734 |
|
|
|
154 |
|
|
|
(282 |
) |
Interest payable on notes payable |
|
|
313 |
|
|
|
201 |
|
|
|
115 |
|
Net cash provided by operating activities |
|
|
26,387 |
|
|
|
20,756 |
|
|
|
15,401 |
|
Cash Flows From Investing Activities |
|
|
|
|
|
|
|
|
|
|
|
|
Restricted certificates of deposit and escrow |
|
$ |
(1) |
|
|
$ |
110 |
|
|
$ |
335 |
|
Acquisition of furniture, equipment and leasehold improvements |
|
|
(275) |
|
|
|
(257 |
) |
|
|
(606 |
) |
Earn-outs paid related to acquisitions completed before January 1, 2009 |
|
|
(703) |
|
|
|
(720 |
) |
|
|
(663 |
) |
Acquisition of Milbank, net of cash acquired |
|
|
— |
|
|
|
— |
|
|
|
(3,357 |
) |
Acquisition of Ten-Sixty |
|
|
(2,500) |
|
|
|
— |
|
|
|
— |
|
Purchase of investments |
|
|
— |
|
|
|
(42 |
) |
|
|
(419 |
) |
Proceeds from sale of investments |
|
|
— |
|
|
|
139 |
|
|
|
234 |
|
Net cash used in investing activities |
|
|
(3,479) |
|
|
|
(770 |
) |
|
|
(4,476 |
) |
Cash Flows From Financing Activities |
|
|
|
|
|
|
|
|
|
|
|
|
Earn-outs paid related to acquisitions completed on or after January 1, 2009 |
|
$ |
(462) |
|
|
$ |
(75 |
) |
|
$ |
— |
|
Borrowings under revolving credit facility |
|
|
7,000 |
|
|
|
— |
|
|
|
— |
|
Payments under revolving credit facility |
|
|
(4,000) |
|
|
|
— |
|
|
|
— |
|
Contributions from partners |
|
|
165 |
|
|
|
— |
|
|
|
13 |
|
Redemptions of partners’ interests |
|
|
(451) |
|
|
|
(222 |
) |
|
|
(237 |
) |
Repayments of notes payable |
|
|
(2,217) |
|
|
|
(1,695 |
) |
|
|
(1,445 |
) |
Payments on capital leases |
|
|
(15) |
|
|
|
(20 |
) |
|
|
(16 |
) |
Distributions to partners |
|
|
(29,317) |
|
|
|
(14,749 |
) |
|
|
(9,994 |
) |
Dividends paid on Class A common stock |
|
|
(661) |
|
|
|
— |
|
|
|
— |
|
Offering costs |
|
|
(1,482) |
|
|
|
— |
|
|
|
— |
|
Payments from partners on notes receivable |
|
|
887 |
|
|
|
2,864 |
|
|
|
1,083 |
|
Purchase of Class B units from partners of Silvercrest L.P. |
|
|
(35,365) |
|
|
|
— |
|
|
|
— |
|
Sale and issuance of Silvercrest Asset Management Group Inc. Class A common stock |
|
|
56,689 |
|
|
|
— |
|
|
|
— |
|
Net cash used in financing activities |
|
|
(9,229) |
|
|
|
(13,897 |
) |
|
|
(10,596 |
) |
Net increase (decrease) in cash and cash equivalents |
|
|
13,679 |
|
|
|
6,089 |
|
|
|
329 |
|
Cash and cash equivalents, beginning of year |
|
|
13,443 |
|
|
|
7,354 |
|
|
|
7,025 |
|
Cash and cash equivalents, end of year |
|
$ |
27,122 |
|
|
$ |
13,443 |
|
|
$ |
7,354 |
|
See accompanying notes to consolidated financial statements.
F-6
Silvercrest Asset Management Group Inc.
Consolidated Statements of Cash Flows
(continued)
(In thousands)
|
|
For the year ended December 31, |
|
|||||||||
|
|
2013 |
|
|
2012 |
|
|
2011 |
|
|||
Supplemental Disclosures of Cash Flow Information |
|
|
|
|
|
|
|
|
|
|
|
|
Net cash paid during the period for: |
|
|
|
|
|
|
|
|
|
|
|
|
Income taxes |
|
$ |
1,067 |
|
|
$ |
995 |
|
|
$ |
855 |
|
Interest |
|
|
316 |
|
|
|
225 |
|
|
|
114 |
|
Supplemental Disclosures of Non-cash Financing and Investing Activities |
|
|
|
|
|
|
|
|
|
|
|
|
Notes receivable from new partners issued as capital contributions to Silvercrest L.P. |
|
$ |
455 |
|
|
$ |
112 |
|
|
$ |
836 |
|
Accrual of partner incentive distributions |
|
|
6,000 |
|
|
|
— |
|
|
|
— |
|
Issuance of notes for redemption of partnership interest |
|
|
5,300 |
|
|
|
— |
|
|
|
34 |
|
Earnout accrual for acquisition of Marathon Capital Group, LLC |
|
|
1,795 |
|
|
|
1,061 |
|
|
|
419 |
|
Earnout accrual for acquisition of Milbank |
|
|
— |
|
|
|
— |
|
|
|
1,726 |
|
Issuance of notes payable for acquisition of Milbank |
|
|
— |
|
|
|
— |
|
|
|
3,181 |
|
Issuance of notes payable for acquisition of Ten-Sixty |
|
|
1,374 |
|
|
|
— |
|
|
|
— |
|
Issuance of shares for acquisition of Milbank |
|
|
— |
|
|
|
— |
|
|
|
3,105 |
|
Issuance of shares and call rights option for acquisition of |
|
|
— |
|
|
|
147 |
|
|
|
— |
|
Recognition of deferred tax assets as a result of IPO |
|
|
26,097 |
|
|
|
— |
|
|
|
— |
|
Recognition of tax receivable agreement liability |
|
|
15,271 |
|
|
|
— |
|
|
|
— |
|
See accompanying notes to consolidated financial statements.
F-7
Silvercrest Asset Management Group Inc.
Notes to Consolidated Financial Statements
As of and for the Years ended December 31, 2013, 2012 and 2011
(Dollars in thousands)
1. ORGANIZATION AND BUSINESS
Silvercrest Asset Management Group Inc. (“Silvercrest”), together with its consolidated subsidiaries (collectively the “Company”), was formed as a Delaware corporation on July 11, 2011. Silvercrest was formed for the purpose of completing a public offering and related transactions in order to carry on the business of Silvercrest L.P. and its subsidiaries.
Silvercrest L.P., together with its consolidated subsidiaries (collectively “SLP”), provides investment management and family office services to individuals and families and their trusts, and to endowments, foundations and other institutional investors primarily located in the United States of America. The business includes the management of funds of funds, and other investment funds, collectively referred to as the “Silvercrest Funds”.
SLP was formed on December 10, 2008 and commenced operations on January 1, 2009.
On March 11, 2004, SLP acquired 100% of the outstanding shares of James C. Edwards Asset Management, Inc. (“JCE”) and subsequently changed JCE’s name to Silvercrest Financial Services, Inc. (“SFS”). On December 31, 2004, SLP acquired 100% of the outstanding shares of The LongChamp Group, Inc. (now SAM Alternative Solutions, Inc.) (“LGI”). Effective March 31, 2005, SLP entered into an Asset Contribution Agreement with and acquired all of the assets, properties, rights and certain liabilities of Heritage Financial Management, LLC (“HFM”). Effective October 3, 2008, SLP acquired 100% of the outstanding limited liability company interests of Marathon Capital Group, LLC (“MCG”) through a limited liability company interest purchase agreement dated September 22, 2008. On November 1, 2011, SLP acquired certain assets of Milbank Winthrop & Co. (“Milbank”). On April 1, 2012, SLP acquired the LLC interests of MW Commodity Advisors, LLC (“Commodity Advisors”). On March 28, 2013, SLP acquired certain assets of Ten-Sixty Asset Management, LLC (“Ten-Sixty”). See Notes 3, 7 and 8 for additional information related to goodwill and intangible assets arising from these acquisitions.
Reorganization and Initial Public Offering
Pursuant to a reorganization agreement effective on June 26, 2013, Silvercrest became the sole general partner in Silvercrest L.P. and its only material asset is the general partner interest in Silvercrest L.P., represented by 7,522,974 Class A units or approximately 63% of the economic interests of Silvercrest L.P. Effective June 26, 2013, Silvercrest controls all of the businesses and affairs of Silvercrest L.P. and, through Silvercrest L.P. and its subsidiaries, continues to conduct the business previously conducted by these entities prior to the reorganization.
On July 2, 2013, Silvercrest completed the initial public offering of 4,790,684 of its Class A common shares at $11.00 per share (the “IPO”). Silvercrest’s stock began trading on June 27, 2013 on NASDAQ under the symbol “SAMG”. The net proceeds from the IPO were $47,920, after payment of underwriting discounts and commissions of $3,324 and offering expenses paid by Silvercrest of $1,454.
On July 12, 2013, Silvercrest sold an additional 718,603 shares of its Class A common stock, at a public offering cost of $11.00 per share, pursuant to the exercise in full of the over-allotment option that the Company granted to the underwriters in connection with its initial public offering. The exercise of the over-allotment option resulted in gross proceeds of $7,905 and net proceeds, after expenses, of $7,379, after payment of underwriting discounts of $498 and offering expenses of $28. Following consummation of this issuance of 718,603 shares of Class A Common Stock, Silvercrest had outstanding 5,509,297 shares of Class A Common Stock.
The accompanying Consolidated Statement of Financial Position as of December 31, 2012, the portion of operating results included in the Consolidated Statement of Operations for the year ended December 31, 2013 that relates to the six months ended June 30, 2013, the portion of the Consolidated Statement of Cash Flows for the year ended December 31, 2013 that relates to the six months ended June 30, 2013, and the operating results included in the Consolidated Statement of Operations for the years ended December 31, 2012 and 2011, and the activities related to the Consolidated Statements of Cash Flows for years ended December 31, 2012 and 2011 are those of SLP, the Company’s accounting predecessor. The results of operations for the year ended December 31, 2013 represent the combination of SLP’s results of operations for the six months ended June 30, 2013 and Silvercrest’s results of operation for the six months ended December 31, 2013.
F-8
In connection with the IPO and the reorganization of SLP, Silvercrest and SLP entered into a series of transactions in order to reorganize their capital structures and complete the IPO. The reorganization and IPO transactions included, among others, the following:
— | GP LLC (SLP’s general partner prior to the reorganization) distributed all of its interests in SLP to its members on a pro rata basis in accordance with each member’s interest in GP LLC; |
— | SLP completed a unit distribution of 19.64 Class B partnership units for each outstanding and vested limited partnership unit prior to the consummation of the IPO which resulted in 10,000,000 outstanding Class B units; |
— | GP LLC transferred its rights as general partner of SLP to Silvercrest, which became the sole general partner of SLP, and GP LLC was dissolved thereafter; |
— | The partnership agreement of SLP was amended, effective as of the consummation of the IPO, to eliminate the call and put rights of SLP and its partners, respectively upon a partner’s death, or, if applicable, termination of employment, which required all limited partner’s units to be classified as temporary equity in SLP’s Consolidated Financial Statements; |
— | For each Class B unit of SLP, Silvercrest issued one share of Class B common stock to the holders of Class B units of SLP, in exchange for its par value which was funded by SLP; |
— | Silvercrest entered into a tax receivable agreement with each limited partner of SLP to return 85% of the tax benefits, estimated to be $15,271 as of December 31, 2013, that it receives as a result of its ability to step up its tax basis in the partnership units of SLP that it acquired from partners of SLP; |
— | A special distribution by SLP of $10,000 was made to its existing partners prior to the consummation of the IPO, of which $7,000 was funded by borrowings under a credit facility with City National Bank; this special distribution, which was paid in July 2013, was treated as an equity transaction; |
— | A special bonus payment by SLP was made to non-principals of $754 which was paid in July 2013, and was recorded as compensation expense during the quarter ended June 30, 2013; |
— | Partner incentive distributions earned for the six months ended June 30, 2013 were treated as equity transactions and were accrued in accrued compensation as of December 31, 2013; and |
— | The purchase of 3,540,684 Class B units from partners of SLP at an offering price of $11.00 per unit, as adjusted for underwriting discounts and commissions of $2,457 and offering expenses of $1,126, resulted in net proceeds of $35,365 to the selling partners. The Class B units acquired by Silvercrest were converted into Class A units of SLP. |
Modification of Units of SLP
As part of the reorganization, the limited partner units of SLP were modified.
The Class B units (previously limited partnership units) of SLP, which are held by employee-partners, were modified to eliminate a cash redemption feature. Prior to the reorganization, the terms of the limited partnership units included call and put rights to redeem the units from a holder whose employment by SLP had been terminated. As a result of the redemption feature, SLP was required to account for the limited partnership units held by employee-partners as temporary equity. At the time of the reorganization and as a result of the elimination of the redemption feature, SLP reclassified the redeemable equity of its limited partners to permanent equity. Any deferred equity units that were unvested at the time of the reorganization will continue to be reflected as share-based payment awards and will be expensed as compensation over the remaining vesting period (see Note 16, “Equity-based Compensation”).
Tax Receivable Agreement
In connection with the IPO and reorganization of SLP, Silvercrest entered into a tax receivable agreement (the “TRA”) with the partners of SLP that will require it to pay them 85% of the amount of cash savings, if any, in U.S. federal, state and local income tax that it actually realizes (or is deemed to realize in the case of an early termination payment by it, or a change in control) as a result of the increases in tax basis and certain other tax benefits related to entering into the TRA, including tax benefits attributable to payments under the TRA. This will be Silvercrest’s obligation and not the obligation of SLP. Silvercrest expects to benefit from the remaining 15% of cash savings, if any, realized.
The TRA was effective upon the consummation of the IPO and will continue until all such tax benefits have been utilized or expired, unless Silvercrest exercises its right to terminate the TRA for an amount based on an agreed upon value of the payments remaining to be made under the agreement. The TRA will automatically terminate with respect to Silvercrest’s obligations to a partner if a partner (i) is terminated for cause, (ii) breaches his or her non-solicitation covenants with Silvercrest or any of its subsidiaries or (iii) voluntarily resigns or retires and competes with Silvercrest or any of its subsidiaries in the 12-month period following resignation of employment or retirement, and no further payments will be made to such partner under the TRA.
F-9
For purposes of the TRA, cash savings in income tax will be computed by comparing Silvercrest’s actual income tax liability to the amount of such taxes that it would have been required to pay had there been no increase in its share of the tax basis of the tangible and intangible assets of SLP.
Estimating the amount of payments that Silvercrest may be required to make under the TRA is imprecise by its nature, because the actual increase in its share of the tax basis, as well as the amount and timing of any payments under the TRA, will vary depending upon a number of factors, including:
— | the timing of exchanges of Class B units for shares of Silvercrest’s Class A common stock—for instance, the increase in any tax deductions will vary depending on the fair market value, which may fluctuate over time, of the depreciable and amortizable assets of SLP at the time of the exchanges; |
— | the price of Silvercrest’s Class A common stock at the time of exchanges of Class B units—the increase in Silvercrest’s share of the basis in the assets of SLP, as well as the increase in any tax deductions, will be related to the price of Silvercrest’s Class A common stock at the time of these exchanges; |
— | the extent to which these exchanges are taxable—if an exchange is not taxable for any reason (for instance, if a principal who holds Class B units exchanges units in order to make a charitable contribution), increased deductions will not be available; |
— | the tax rates in effect at the time Silvercrest utilizes the increased amortization and depreciation deductions; and |
— | the amount and timing of Silvercrest’s income—Silvercrest will be required to pay 85% of the tax savings, as and when realized, if any. If Silvercrest does not have taxable income, it generally will not be required to make payments under the TRA for that taxable year because no tax savings will have been actually realized. |
In addition, the TRA provides that, upon certain mergers, asset sales, other forms of business combinations or other changes of control, Silvercrest’s (or its successors’) obligations with respect to exchanged or acquired Class B units (whether exchanged or acquired before or after such transaction) would be based on certain assumptions, including that Silvercrest would have sufficient taxable income to fully utilize the deductions arising from the increased tax deductions and tax basis and other benefits related to entering into the TRA.
Decisions made by the continuing partners of SLP in the course of running Silvercrest’s business, such as with respect to mergers, asset sales, other forms of business combinations or other changes in control, may influence the timing and amount of payments that are received by an exchanging or selling principal under the TRA. For example, the earlier disposition of assets following an exchange or acquisition transaction will generally accelerate payments under the TRA and increase the present value of such payments, and the disposition of assets before an exchange or acquisition transaction will increase an existing owner’s tax liability without giving rise to any rights of a principal to receive payments under the TRA.
Were the Internal Revenue Service to successfully challenge the tax basis increases described above, Silvercrest would not be reimbursed for any payments previously made under the TRA. As a result, in certain circumstances, Silvercrest could make payments under the TRA in excess of its actual cash savings in income tax.
IPO and Use of Proceeds
The net proceeds from the IPO were $47,920. Silvercrest used a portion of the IPO net proceeds to purchase 3,540,684 Class B units of SLP from certain of its partners for $35,365.
The net proceeds from the underwriters’ exercise in full of the over-allotment option that the Company granted to the underwriters in connection with its initial public offering were $7,379.
Silvercrest intends to use the remaining proceeds from the IPO and underwriters’ over-allotment option for general corporate purposes.
Earnings per share and unit
In connection with the reorganization of SLP and the IPO, SLP completed a unit distribution of 19.64 units for each unit outstanding as of the date of the consummation of the IPO.
Weighted average units outstanding for the years ended December 31, 2012 and 2011 reflect the effect of the unit distribution as if it had occurred as of December 31, 2012 and 2011.
F-10
The Company’s basic and diluted average weighted shares outstanding used to determine basic and diluted earnings per share for the year ended December 31, 2013 were determined as follows:
Year ended December 31, 2013:
Basic weighted average shares/units outstanding:
Basic weighted average units outstanding for the six months ended June 30, 2013 |
|
|
5,167,709 |
|
Basic weighted average Class A shares outstanding for the six months ended December 31, 2013 |
|
|
2,977,767 |
|
Total shares/units for purposes of calculating basic net income per share/unit |
|
|
8,145,476 |
|
Diluted weighted average shares/units outstanding:
Diluted weighted average units outstanding for the six months ended June 30, 2013 (1) |
|
|
5,396,258 |
|
Diluted weighted average Class A shares outstanding for the six months ended December 31, 2013 |
|
|
2,977,767 |
|
Total shares/ units for purposes of calculating diluted net income per share/ unit |
|
|
8,374,025 |
|
(1) | Includes 228,549 performance units which are conditionally issuable Class B units that would be issuable if June 30, 2013 was the end of the contingency period. |
Diluted weighted average units outstanding for the years ended December 31, 2012 and 2011 includes 146,452 and zero performance units, respectively, which are conditionally issuable units that would be issuable if December 31, 2012 and 2011 was the end of the contingency period.
2. SUMMARY OF SIGNIFICANT ACCOUNTING POLICIES
Basis of Presentation and Principles of Consolidation
The accompanying consolidated financial statements include the accounts of Silvercrest and its wholly-owned subsidiaries, SLP, SAMG LLC, SFS, MCG, Silvercrest Investors LLC and Silvercrest Investors II LLC as of and for the year ended December 31, 2013. The consolidated financial statements for the years ended December 31, 2012 and 2011 are of the Company’s accounting predecessor, SLP, and its consolidated subsidiaries. All intercompany transactions and balances have been eliminated.
The Company evaluates for consolidation those entities it controls through a majority voting interest or otherwise, including those SLP funds in which the general partner or equivalent is presumed to have control over the fund. The initial step in our determination of whether a fund for which SLP is the general partner is required to be consolidated is assessing whether the fund meets the definition of a variable interest entity (VIE). None of funds for which SLP is the general partner met the definition of a VIE during the three years ended December 31, 2013, as the total equity at risk of each fund is sufficient for the fund to finance its activities without additional subordinated financial support provided by any parties, including the equity holders.
SLP then considers whether the fund is a voting interest entity (VoIE) in which the unaffiliated limited partners have substantive “kick-out” rights that provide the ability to dissolve (liquidate) the limited partnership or otherwise remove the general partner without cause. SLP considers the “kick-out” rights to be substantive if the general partner for the fund can be removed by the vote of a simple majority of the unaffiliated limited partners and there are no significant barriers to the unaffiliated limited partners’ ability to exercise these rights in that among other things (1) there are no conditions or timing limits on when the rights can be exercised, (2) there are no financial or operational barriers associated with replacing the general partner, (3) there are a number of qualified replacement investment advisors that would accept appointment at the same fee level, (4) each fund’s documents provide for the ability to call and conduct a vote, and (5) the information necessary to exercise the kick-out rights and related vote are available from the fund and its administrator.
As of December 31, 2013 and December 31, 2012 and for the years ended December 31, 2013, 2012 and 2011, all of the funds for which SLP was the general partner have substantive “kick-out” rights and therefore neither SLP nor Silvercrest consolidated any of the Silvercrest Funds.
F-11
Non-controlling interest
As of December 31, 2013, Silvercrest holds approximately 63% of the economic interests in SLP. Silvercrest is the sole general partner of SLP and, therefore, controls the management of SLP. As a result, Silvercrest consolidates the financial position and the results of operations of SLP and its subsidiaries, and records a non-controlling interest, as a separate component of stockholders’ equity on its Consolidated Statement of Financial Condition for the remaining economic interests in SLP. The non-controlling interest in the income or loss of SLP is included in the Consolidated Statement of Operations as a reduction or addition to net income derived from SLP.
Segment Reporting
The Company views its operations as comprising one operating segment. Each of the Company’s acquired businesses have similar economic characteristics and have been fully integrated upon acquisition. Furthermore, our chief operating decision maker, which is the Company’s Chief Executive Officer, monitors and reviews financial information at a consolidated level for assessing operating results and the allocation of resources.
Use of Estimates
The preparation of the Consolidated Financial Statements requires management to make estimates and assumptions that affect the reported amounts of assets and liabilities, the disclosure of contingent assets and liabilities at the date of the Consolidated Financial Statements and the reported amounts of revenues, expenses and other income reported in the Consolidated Financial Statements and the accompanying notes. Actual results could differ from those estimates. Significant estimates and assumptions made by management include the fair value of acquired assets and liabilities, equity based compensation, accounting for income taxes, the useful lives of long-lived assets and other matters that affect the Consolidated Financial Statements and related disclosures.
Cash and Cash Equivalents
The Company considers all highly liquid securities with original maturities of 90 days or less when purchased to be cash equivalents.
Restricted Certificates of Deposit
Certain certificates of deposit held at a major financial institution are restricted and serve as collateral for letters of credit for the Company’s lease obligations as described in Note 10.
Equity Method Investments
Entities and investments over which the Company exercises significant influence over the activities of the entity but which do not meet the requirements for consolidation are accounted for using the equity method of accounting, whereby the Company records its share of the underlying income or losses of these entities. Intercompany profit arising from transactions with affiliates is eliminated to the extent of its beneficial interest. Equity in losses of equity method investments is not recognized after the carrying value of an investment, including advances and loans, has been reduced to zero, unless guarantees or other funding obligations exist.
The Company evaluates its equity method investments for impairment, whenever events or changes in circumstances indicate that the carrying amounts of such investments may not be recoverable. The difference between the carrying value of the equity method investment and its estimated fair value is recognized as an impairment when the loss in value is deemed other than temporary. The Company’s equity method investments approximate their fair value at December 31, 2013 and December 31, 2012. The fair value of the equity method investments is estimated based on the Company’s share of the fair value of the net assets of the equity method investee which consist of Level I and Level II securities. No impairment charges related to equity method investments were recorded during the years ended December 31, 2013, 2012 and 2011.
Receivables and Due from Silvercrest Funds
Receivables consist primarily of amounts for advisory fees due from clients and management fees, and are stated as net realizable value. The Company maintains an allowance for doubtful receivables based on estimates of expected losses and specific identification of uncollectible accounts. The Company charges actual losses to the allowance when incurred.
F-12
Furniture, Equipment and Leasehold Improvements
Furniture, equipment and leasehold improvements consist primarily of furniture, fixtures and equipment, computer hardware and software and leasehold improvements and are recorded at cost less accumulated depreciation. Depreciation is calculated using the straight-line method over the assets’ estimated useful lives, which for leasehold improvements is the lesser of the lease term or the life of the asset, generally 10 years, and 3 to 7 years for other fixed assets.
Business Combinations
The Company accounts for business combinations using the acquisition method of accounting. The acquisition method of accounting requires that purchase price, including the fair value of contingent consideration, of the acquisition be allocated to the assets acquired and liabilities assumed using the fair values determined by management as of the acquisition date. Contingent consideration is recorded as part of the purchase price when such contingent consideration is not based on continuing employment of the selling shareholders. Contingent consideration that is related to continuing employment is recorded as compensation expense. Payments made for contingent consideration recorded as part of an acquisition’s purchase price are reflected as financing activities in the Company’s Consolidated Statements of Cash Flows.
For acquisitions completed subsequent to January 1, 2009, the Company remeasures the fair value of contingent consideration at each reporting period using a probability-adjusted discounted cash flow method based on significant inputs not observable in the market and any change in the fair value from either the passage of time or events occurring after the acquisition date, is recorded in earnings. Contingent consideration payments that exceed the acquisition date fair value of the contingent consideration are reflected as an operating activity in the Consolidated Statements of Cash Flows.
Goodwill and Intangible Assets
Goodwill consists of the excess of the purchase price over the fair value of identifiable net assets of businesses acquired. Goodwill is not amortized and is generally evaluated for impairment using a two-step process that is performed at least annually, or whenever events or circumstances indicate that impairment may have occurred.
In September 2011, the FASB issued ASU 2011-08, “Testing Goodwill for Impairment”, which provided new accounting guidance on testing goodwill for impairment. The enhanced guidance provides an entity the option to first perform a qualitative assessment of whether a reporting unit’s fair value is more likely than not less than its carrying value, including goodwill. In performing its qualitative assessment, an entity considers the extent to which adverse events or circumstances identified, such as changes in economic conditions, industry and market conditions or entity specific events, could affect the comparison of the reporting unit’s fair value with its carrying amount. If an entity concludes that the fair value of a reporting unit is more likely than not less than its carrying amount, the entity is required to perform the currently prescribed two-step goodwill impairment test to identify potential goodwill impairment and, accordingly, measure the amount, if any, of goodwill impairment loss to be recognized for that reporting unit. The guidance was effective for the Company as of January 1, 2012. The Company utilized this option when performing its annual impairment assessment in 2013 and concluded that its single reporting unit’s fair value was more likely than not greater than its carrying value, including goodwill.
The Company assessed goodwill using the two-step process in 2012. The first step of the two-step process is a comparison of the fair value of a reporting unit with its carrying amount, including goodwill. If the fair value of the reporting unit exceeds its carrying value, goodwill of the reporting unit is not considered impaired and the second step is unnecessary. If the carrying value of the reporting unit exceeds its fair value, a second step is performed to measure the amount of impairment by comparing the carrying amount of the goodwill to a determination of the implied fair value of the goodwill. If the carrying amount of the goodwill is greater than the implied value, an impairment loss is recognized for the difference. The implied value of the goodwill is determined as of the test date by performing a purchase price allocation, as if the reporting unit had just been acquired, using currently estimated fair values of the individual assets and liabilities of the reporting unit, together with an estimate of the fair value of the reporting unit taken as a whole. The estimate of the fair value of the reporting unit is based upon information available regarding prices of similar groups of assets, or other valuation techniques including present value techniques based upon estimates of future cash flows.
The Company has one reporting unit at December 31, 2013 and 2012. No goodwill impairment charges were recorded during the years ended December 31, 2013, 2012 and 2011.
Identifiable finite-lived intangible assets are amortized over their estimated useful lives ranging from 3 to 20 years. The method of amortization is based on the pattern over which the economic benefits, generally expected undiscounted cash flows, of the intangible asset are consumed. Intangible assets for which no pattern can be reliably determined are amortized using the straight-line method. Intangible assets consist primarily of the contractual right to future management, advisory and performance fees from customer contracts or relationships.
F-13
Long-lived Assets
Long-lived assets of the Company are reviewed for impairment whenever events or changes in circumstances indicate that the net carrying amount of the asset may not be recoverable. In connection with such review, the Company also re-evaluates the periods of depreciation and amortization for these assets. Recoverability of assets to be held and used is measured by a comparison of the carrying amount of an asset to undiscounted future net cash flows expected to be generated by the asset. If such assets are considered to be impaired, the impairment to be recognized is measured by the amount by which the carrying amount of the assets exceeds their fair value.
Initial Public Offering Costs
During 2012, the Company incurred $2,816 of professional fees and other costs associated with its planned initial public offering. These costs are included in general, administrative and other in the Consolidated Statement of Operations. These costs were expensed upon the withdrawal of the Company’s registration statement in November 2012.
Partner Distributions
Partner incentive allocations, which are determined by the general partner, can be formula-based or discretionary. Prior to the reorganization and consummation of the IPO, incentive allocations are considered distributions of net income as stipulated by SLP’s Amended and Restated Limited Partnership Agreement in effect prior to the reorganization and were recognized in the period in which they were paid. Subsequent to the reorganization and consummation of the IPO, partner incentive allocations are treated as compensation expense and recognized in the period in which they are earned. In the event there is insufficient distributable cash flow to make incentive distributions, the general partner in its sole and absolute discretion may determine not to make any distributions called for under the partnership agreement. The remaining net income or loss after partner incentive allocations is generally allocated to unit holders based on their pro rata ownership.
Redeemable Partnership Units
Prior to the reorganization, redeemable partnership units in SLP consisted of units issued to our founders and those purchased by certain of our employees. These capital units entitled the holder to a share of the distributions of SLP. Units were subject to certain redemption features. Upon the termination of employment of the terminated employee, as defined, SLP had a right to call the units. In addition, the terminated employee had a right to put the units to SLP upon termination or death, provided the terminated employee had complied with certain restrictions, as described in the partnership agreement. In accordance with the provisions of SLP’s Second Amended and Restated Limited Partnership Agreement, the put described above expired upon the consummation of our IPO.
As the units were redeemable at the option of the holder and were not mandatorily redeemable, the redeemable partnership units were classified outside of permanent partner’s capital as of December 31, 2012. The units were adjusted to their redemption value at December 31, 2012 with the increase or decrease in redemption value being charged to excess of liabilities, redeemable partners’ capital and partner’s capital over assets.
Subsequent to the completion of the reorganization and IPO, if a principal of SLP is terminated for cause, SLP would have the right to redeem all of the vested Class B units collectively held by the principal and his or her permitted transferees for a purchase price equal to the lesser of (i) the aggregate capital account balance in SLP of the principal and his or her permitted transferees and (ii) the purchase price paid by the terminated principal to first acquire the Class B units.
SLP also makes distributions to its partners of various nature including incentive payments, profit distributions and tax distributions.
Class A Common Stock
The Company’s Class A stockholders are entitled to one vote for each share held of record on all matters submitted to a vote of the Company’s stockholders. Also, Class A stockholders are entitled to receive dividends, when and if declared by the Company’s board of directors, out of funds legally available therefor, subject to any statutory or contractual restrictions on the payment of dividends and to any restrictions on the payment of dividends imposed by the terms of any outstanding preferred stock. Dividends consisting of shares of Class A common stock may be paid only as follows: (i) shares of Class A common stock may be paid only to holders of shares of Class A common stock and (ii) shares will be paid proportionately with respect to each outstanding share of the Company’s Class A common stock. Upon the Company’s liquidation, dissolution or winding-up, or the sale of all, or substantially all, of the Company’s assets, after payment in full of all amounts required to be paid to creditors and to holders of preferred stock having a liquidation preference, if any, the Class A stockholders will be entitled to share ratably in the Company’s remaining assets available for distribution to Class A stockholders. Class B units of SLP held by principals will be exchangeable for shares of the Company’s Class A common stock, on a one-for-one basis, subject to customary adjustments for share splits, dividends and reclassifications.
F-14
Class B Common Stock
Shares of the Company’s Class B common stock are issuable only in connection with the issuance of Class B units of SLP. When a vested or unvested Class B unit is issued by SLP, the Company will issue the holder one share of its Class B common stock in exchange for the payment of its par value. Each share of the Company’s Class B common stock will be redeemed for its par value and cancelled by the Company if the holder of the corresponding Class B unit exchanges or forfeits its Class B unit pursuant to the terms of the Second Amended and Restated Limited Partnership Agreement of SLP, the terms of the Silvercrest Asset Management Group Inc. 2012 Equity Incentive Plan (the “2012 Equity Incentive Plan”). The Company’s Class B stockholders will be entitled to one vote for each share held of record on all matters submitted to a vote of the Company’s stockholders. The Company’s Class B stockholders will not participate in any dividends declared by the Company’s board of directors. Upon the Company’s liquidation, dissolution or winding-up, or the sale of all, or substantially all, of its assets, Class B stockholders only will be entitled to receive the par value of the Company’s Class B common stock.
Revenue Recognition
Revenue is recognized ratably over the period in which services are performed. Revenue consists primarily of investment advisory fees, family office services fees and fund management fees. Investment advisory fees are typically billed quarterly in advance at the beginning of the quarter or in arrears after the end of the quarter, based on a contractually specified percentage of the assets managed. For investment advisory fees billed in advance, the value of assets managed is determined based on the value of the customer’s account as of the last trading day of the preceding quarter. For investment advisory fees billed in arrears the value of assets managed is determined based on the value of the customer’s account on the last day of the quarter being billed. Family office services fees are typically billed quarterly in advance at the beginning of the quarter or in arrears after the end of the quarter based on a contractual percentage of the assets managed or based on a fixed fee arrangement. Management fees from proprietary and non-proprietary funds are calculated as a percentage of net asset values measured at the beginning of a month or quarter or at the end of a quarter, depending on the fund.
The Company accounts for performance based revenue in accordance with ASC 605-20-S99, “Accounting for Management Fees Based on a Formula”, by recognizing performance fees and allocations as revenue only when it is certain that the fee income is earned and payable pursuant to the relevant agreements, and no contingencies remain. Performance fee contingencies are typically resolved at the end of each annual period. In certain arrangements, the Company is only entitled to receive performance fees and allocations when the return on assets under management exceeds certain benchmark returns or other performance targets. The Company records performance fees and allocations as a component of revenue.
Equity-Based Compensation
Equity-based compensation cost relating to the issuance of share-based awards to employees is based on the fair value of the award at the date of grant, which is expensed ratably over the requisite service period, net of estimated forfeitures. The forfeiture assumption is ultimately adjusted to the actual forfeiture rate. Therefore, changes in the forfeiture assumptions may affect the timing of the total amount of expense recognized over the vesting period. The service period is the period over which the employee performs the related services, which is normally the same as the vesting period. Equity-based awards that do not require future service are expensed immediately. Equity-based awards that have the potential to be settled in cash at the election of the employee or prior to the reorganization related to redeemable partnership units are classified as liabilities (“Liability Awards”) and are adjusted to fair value at the end of each reporting period. Distributions associated with Liability Awards not expected to vest are accounted for as compensation expense in the Consolidated Statements of Operations.
Leases
The Company expenses the net lease payments associated with operating leases on a straight-line basis over the respective lease term including any rent-free periods. Leasehold improvements are recorded at cost and are depreciated using the straight-line method over the lesser of the estimated useful lives of the improvements (generally 10 years) or the remaining lease term.
Income Taxes
Silvercrest and SFS are subject to federal and state corporate income tax, which requires an asset and liability approach to the financial accounting and reporting of income taxes. SLP is not subject to federal and state income taxes, since all income, gains and losses are passed through to its partners. SLP is, however, subject to New York City unincorporated business tax. With respect to the Company’s incorporated entities, the annual tax rate is based on the income, statutory tax rates and tax planning opportunities available in the various jurisdictions in which the Company operates. Tax laws are complex and subject to different interpretations by the taxpayer and respective governmental taxing authorities. Judgment is required in determining the tax expense and in evaluating tax positions. The tax effects of an uncertain tax position (“UTP”) taken or expected to be taken in income tax returns are recognized only if it is “more likely-than-not” to be sustained on examination by the taxing authorities, based on its technical merits as of the reporting date. The tax benefits recognized in the financial statements from such a position are measured based on the largest benefit that has a greater than
F-15
fifty percent likelihood of being realized upon ultimate settlement. The Company recognizes estimated accrued interest and penalties related to UTPs in income tax expense.
The Company recognizes the benefit of a UTP in the period when it is effectively settled. Previously recognized tax positions are derecognized in the first period in which it is no longer more likely than not that the tax position would be sustained upon examination.
Recent Accounting Developments
In June 2013, the FASB issued ASU 2013-08, “Financial Services-Investment Companies (Topic 946): Amendments to the Scope, Measurement, and Disclosure Requirements.” The ASU modifies the guidance in ASC 946 for determining whether an entity is an investment company, as well as the measurement and disclosure requirements for investment companies. The ASU also clarifies the characteristics of an investment company and requires an investment company to measure noncontrolling ownership interests in other investment companies at fair value rather than using the equity method of accounting. The ASU does not change the current accounting where a noninvestment company parent retains the specialized accounting applied by an investment company subsidiary in consolidation. The ASU is effective for the fiscal years and interim periods beginning after December 15, 2013. This ASU is not expected to have a material effect on the Company’s results of operations or financial position.
3. ACQUISITIONS
Milbank:
On November 1, 2011, the Company acquired certain assets of Milbank. A fair value adjustment to contingent purchase price consideration of $148 and ($42) was recorded at December 31, 2013 and December 31, 2012, respectively, and is included in general, and administrative expenses in the Consolidated Statement of Operations for the years then ended. The Company has a liability of $1,295 and $1,609 related to Milbank included in accounts payable and accrued expenses in the Consolidated Statement of Financial Condition as of December 31, 2013 and December 31, 2012, respectively, for contingent consideration.
Commodity Advisors:
On April 1, 2012, SLP acquired Commodity Advisors. Commodity Advisors is the general partner of MW Commodity Strategies, L.P. (the “MW Commodity Fund LLC”), a fund whose investment objective is to seek superior risk adjusted returns through strategic, sector-based investments with commodity and macro trading investment managers. The acquisition of Commodity Advisors adds another strategy to the Company’s investment management, wealth planning and reporting capabilities, including proprietary value equity and fixed income disciplines and alternative investment advisory services. On April 1, 2012, SLP, in exchange for the member interests of Commodity Advisors, issued units of SLP and GP LLC, at closing, with a fair value of $132. Furthermore, SLP is obligated to make quarterly contingent payments if incremental income, as defined in the purchase agreement, exceeds various thresholds. As these contingent payments are tied to the continued employment by SLP of the former member of Commodity Advisors, they will be considered compensation expense in the period in which such contingent payments are earned (See Note 10). SLP is obligated to make a future one-time earnout payment in units equal to the difference between $800 and the redemption value of the units issued at closing (as adjusted for the reorganization of SLP), if incremental revenue, as defined, reaches an amount equal to $400 prior to March 31, 2014.
Units issued |
|
$ |
132 |
|
Call rights option issued |
|
|
15 |
|
Total purchase consideration |
|
$ |
147 |
|
The following table summarizes the final amounts allocated to the acquired assets and assumed liabilities. The excess of the purchase price over the fair values of assets acquired and liabilities assumed was allocated to goodwill and intangible assets.
Receivables |
|
$ |
7 |
|
Liabilities |
|
|
(7 |
) |
Total fair value of net tangible assets acquired |
|
|
— |
|
Goodwill |
|
|
147 |
|
Total purchase consideration |
|
$ |
147 |
|
Ten-Sixty:
On March 28, 2013, SLP executed an Asset Purchase Agreement with and closed the related transaction to acquire certain assets of Ten-Sixty. Ten-Sixty is a registered investment adviser that advises on approximately $1.9 billion of assets primarily on behalf of
F-16
institutional clients. This strategic acquisition enhances the Company’s hedge fund and investment manager due diligence capabilities, risk management analysis and reporting, and enhances its institutional business. Under the terms of the Asset Purchase Agreement, SLP paid cash consideration at closing of $2,500 and issued a promissory note to Ten-Sixty in the principal amount of $1,479 subject to adjustment. The principal amount of the promissory note was paid in two initial installments of $218 each on April 30, 2013 and December 31, 2013 and then quarterly installments from June 30, 2014 through March 31, 2017 of $87 each. The principal amount outstanding under this note bears interest at the rate of five percent per annum. During the year ended December 31, 2013, SLP incurred $51 in costs related to the acquisition of Ten-Sixty, and has included these in general and administrative in the Consolidated Statement of Operations.
Cash paid on date of acquisition |
|
$ |
2,500 |
|
Note payable due to Ten-Sixty |
|
|
1,592 |
|
Total purchase consideration |
|
$ |
4,092 |
|
The net tangible assets acquired from the Ten-Sixty transaction were determined to have a fair value of $0.
The following table summarizes the allocation of the excess of the purchase price over the fair value of assets acquired and liabilities assumed which was allocated to goodwill and intangible assets.
Goodwill |
|
$ |
2,345 |
|
Customer relationships (10 years) |
|
|
1,650 |
|
Non-compete agreements (5 years) |
|
|
97 |
|
Total purchase consideration |
|
$ |
4,092 |
|
The Company believes the recorded goodwill is supported by the anticipated revenues and expected synergies of integrating the operations of Ten-Sixty into the Company. Furthermore, there are expected synergies with respect to compensation and benefits and general and administrative costs. All goodwill is expected to be deductible for tax purposes.
The pro forma information below represents consolidated results of operations as if the acquisition of Commodity Advisors occurred on January 1, 2012 and the acquisition of Ten-Sixty occurred on January 1, 2013 and January 1, 2012. The pro forma information has been included for comparative purposes and is not indicative of results of operations of the Company had the acquisitions occurred as of January 1, 2013 and 2012, nor is it necessarily indicative of future results.
|
|
Pro Forma Year |
|
|
Pro Forma Year |
|
|
|
|
|||
Total Revenue |
|
$ |
60,279 |
|
|
$ |
52,390 |
|
|
|
|
|
Net Income |
|
$ |
17,220 |
|
|
$ |
19,846 |
|
|
|
|
|
Revenue and net income of Ten-Sixty for the nine months ended December 31, 2013 which are included in the Consolidated Statement of Operations were $1,020 and $126, respectively.
4. INVESTMENTS AND FAIR VALUE MEASUREMENTS
Investments include $103 and $1,980 as of December 31, 2013 and December 31, 2012, respectively, representing the Company’s equity method investments in affiliated investment funds which have been established and managed by the Company and its affiliates. The Company’s financial interest in these funds can range up to 2%. Despite the Company’s insignificant financial interest, the Company exercises significant influence over these funds as the Company typically serves as the general partner, managing member or equivalent for these funds. During 2007, the Silvercrest Funds granted rights to the unaffiliated investors in each respective fund to provide that a simple majority of the fund’s unaffiliated investors will have the right, without cause, to remove the general partner or equivalent of that fund or to accelerate the liquidation date of that fund in accordance with certain procedures. At December 31, 2013 and 2012, the Company determined that none of the Silvercrest Funds were required to be consolidated. The Company’s involvement with these entities began on the dates that they were formed, which range from July 2003 to July 2008.
F-17
Fair Value Measurements
GAAP establishes a hierarchal disclosure framework which prioritizes and ranks the level of market price observability used in measuring investments at fair value. Market price observability is affected by a number of factors, including the type of investment, the characteristics specific to the investment and the state of the marketplace including the existence and transparency of transactions between market participants. Investments with readily available active quoted prices or for which fair value can be measured from actively quoted prices in an orderly market generally will have a higher degree of market price observability and a lesser degree of judgment used in measuring fair value.
· | Level I: Quoted prices are available in active markets for identic al investments as of the reporting date. The type of investments in Level I include listed equities and listed derivatives. |
· | Level II: Pricing inputs are other than quoted prices in active markets, which are either directly or indirectly observable as of the reporting date, and fair value is determined through the use of models or other valuation methodologies. Investments which are generally included in Level II include corporate bonds and loans, less liquid and restricted equity securities, certain over-the counter derivatives, and certain fund of hedge funds investments in which the Company has the ability to redeem its investment at net asset value at, or within three months of, the reporting date. |
· | Level III: Pricing inputs are unobservable for the investment and includes situations where there is little, if any, market activity for the investment. The inputs into the determination of fair value require significant management judgment or estimation. Investments that are included in Level III generally include general and limited partnership interests in private equity and real estate funds, credit-oriented funds, certain over-the-counter derivatives, funds of hedge funds which use net asset value per share to determine fair value in which the Company may not have the ability to redeem its investment at net asset value at, or within three months of, the reporting date, distressed debt and non-investment grade residual interests in securitizations and collateralized debt obligations. |
· | In certain cases, the inputs used to measure fair value may fall into different levels of the fair value hierarchy. In such cases, the determination of which category within the fair value hierarchy is appropriate for any given investment is based on the lowest level of input that is significant to the fair value measurement. The Company’s assessment of the significance of a particular input to the fair value measurement in its entirety requires judgment and considers factors specific to the investment. |
At December 31, 2013, the Company did not have any financial assets or liabilities that are recorded at fair value on a recurring basis.
The following table summarizes the classification of the Company’s financial assets that are recorded at fair value on a recurring basis in the fair value hierarchy as of December 31, 2012:
|
|
Level I |
|
|
Level II |
|
|
Level III |
|
|
Total |
|
||||
Assets |
|
|
|
|
|
|
|
|
|
|
|
|
|
|
|
|
Cash equivalents – Money Market Funds |
|
$ |
1,020 |
|
|
$ |
— |
|
|
$ |
— |
|
|
$ |
1,020 |
|
At December 31, 2013 and December 31, 2012, financial instruments that are not held at fair value are categorized in the table below:
|
|
December 31, 2013 |
|
|
December 31, 2012 |
|
|
|
|
|||||||||||
|
|
Carrying |
|
|
Fair |
|
|
Carrying |
|
|
Fair |
|
|
Fair Value |
|
|||||
Financial Assets: |
|
|
|
|
|
|
|
|
|
|
|
|
|
|
|
|
|
|
|
|
Cash |
|
$ |
27,122 |
|
|
$ |
27,122 |
|
|
$ |
12,392 |
|
|
$ |
12,392 |
|
|
|
|
|
Restricted Certificates of Deposit and Escrow |
|
$ |
1,021 |
|
|
$ |
1,021 |
|
|
$ |
1,020 |
|
|
$ |
1,020 |
|
|
|
Level 1 |
(1) |
|
|
|
|
|
|
|
|
|
|
|
|
|
|
|
|
|
|
|
|
|
Financial liabilities: |
|
|
|
|
|
|
|
|
|
|
|
|
|
|
|
|
|
|
|
|
Notes Payable |
|
$ |
8,303 |
|
|
$ |
8,303 |
|
|
$ |
3,315 |
|
|
$ |
3,315 |
|
|
|
Level 2 |
(2) |
Borrowings Under Revolving Credit Agreement |
|
$ |
3,000 |
|
|
$ |
3,000 |
|
|
$ |
— |
|
|
$ |
— |
|
|
|
Level 2 |
(2) |
(1) | Restricted certificates of deposit and escrow consists of money market funds that are carried at either cost or amortized cost that approximates fair value due to their short-term maturities. The money market funds are valued through the use of quoted market prices, or $1.00, which is generally the net asset value of the funds. |
(2) | The carrying value of notes payable approximates fair value, which is determined based on interest rates currently available to the Company for similar debt. |
F-18
5. RECEIVABLES, NET
The following is a summary of receivables as of December 31, 2013 and December 31, 2012:
|
|
2013 |
|
|
2012 |
|
||
Management and advisory fees receivable |
|
$ |
1,973 |
|
|
$ |
1,815 |
|
Unbilled receivables |
|
|
3,741 |
|
|
|
1,787 |
|
Other receivables |
|
|
30 |
|
|
|
435 |
|
Receivables |
|
|
5,744 |
|
|
|
4,037 |
|
Allowance for doubtful receivables |
|
|
(339 |
) |
|
|
(362 |
) |
Receivables, net |
|
$ |
5,405 |
|
|
$ |
3,675 |
|
6. FURNITURE, EQUIPMENT AND LEASEHOLD IMPROVEMENTS, NET
The following is a summary of furniture, equipment and leasehold improvements, net as of December 31, 2013 and December 31, 2012:
|
|
2013 |
|
|
2012 |
|
||
Leasehold improvements |
|
$ |
3,679 |
|
|
$ |
3,557 |
|
Furniture and equipment |
|
|
3,672 |
|
|
|
3,526 |
|
Artwork |
|
|
345 |
|
|
|
338 |
|
Total cost |
|
|
7,696 |
|
|
|
7,421 |
|
Accumulated depreciation and amortization |
|
|
(5,783 |
) |
|
|
(5,360 |
) |
Furniture, equipment and leasehold improvements, net |
|
$ |
1,913 |
|
|
$ |
2,061 |
|
Depreciation expense for the years ended December 31, 2013, 2012 and 2011 was $423, $471, and $492, respectively.
7. GOODWILL
The following is a summary of the changes to the carrying amount of goodwill as of December 31, 2013 and December 31, 2012:
|
|
2013 |
|
|
2012 |
|
||
Beginning |
|
|
|
|
|
|
|
|
Gross balance |
|
$ |
33,306 |
|
|
$ |
32,098 |
|
Accumulated impairment losses |
|
|
(17,415 |
) |
|
|
(17,415 |
) |
Net balance |
|
|
15,891 |
|
|
|
14,683 |
|
Purchase price adjustments from earnouts |
|
|
1,795 |
|
|
|
1,061 |
|
Acquisition of Commodity Advisors |
|
|
— |
|
|
|
147 |
|
Acquisition of Ten-Sixty |
|
|
2,345 |
|
|
|
— |
|
Ending |
|
|
|
|
|
|
|
|
Gross balance |
|
|
37,446 |
|
|
|
33,306 |
|
Accumulated impairment losses |
|
|
(17,415 |
) |
|
|
(17,415 |
) |
Net balance |
|
$ |
20,031 |
|
|
$ |
15,891 |
|
F-19
8. INTANGIBLE ASSETS
The following is a summary of intangible assets as of December 31, 2013 and December 31, 2012:
|
|
Customer |
|
|
Other |
|
|
Total |
|
|||
Cost |
|
|
|
|
|
|
|
|
|
|
|
|
Balance, January 1, 2013 |
|
$ |
15,910 |
|
|
$ |
1,566 |
|
|
$ |
17,476 |
|
Acquisition of certain assets of Ten-Sixty |
|
|
1,650 |
|
|
|
97 |
|
|
|
1,747 |
|
Balance, December 31, 2013 |
|
|
17,560 |
|
|
|
1,663 |
|
|
|
19,223 |
|
Useful lives |
|
|
10-20 years |
|
|
|
3-5 years |
|
|
|
|
|
Accumulated amortization |
|
|
|
|
|
|
|
|
|
|
|
|
Balance, January 1, 2013 |
|
|
(4,238 |
) |
|
|
(875 |
) |
|
|
(5,113 |
) |
Amortization expense |
|
|
(1,172 |
) |
|
|
(349 |
) |
|
|
(1,521 |
) |
Balance, December 31, 2013 |
|
|
(5,410 |
) |
|
|
(1,224 |
) |
|
|
(6,634 |
) |
Net book value |
|
$ |
12,150 |
|
|
$ |
439 |
|
|
$ |
12,589 |
|
Cost |
|
|
|
|
|
|
|
|
|
|
|
|
Balance, January 1, 2012 |
|
$ |
15,910 |
|
|
$ |
1,566 |
|
|
$ |
17,476 |
|
Balance, December 31, 2012 |
|
|
15,910 |
|
|
|
1,566 |
|
|
|
17,476 |
|
Useful lives |
|
|
10-20 years |
|
|
|
3-5 years |
|
|
|
|
|
Accumulated amortization |
|
|
|
|
|
|
|
|
|
|
|
|
Balance, January 1, 2012 |
|
|
(3,144 |
) |
|
|
(522 |
) |
|
|
(3,666 |
) |
Amortization expense |
|
|
(1,094 |
) |
|
|
(353 |
) |
|
|
(1,447 |
) |
Balance, December 31, 2012 |
|
|
(4,238 |
) |
|
|
(875 |
) |
|
|
(5,113 |
) |
Net book value |
|
$ |
11,672 |
|
|
$ |
691 |
|
|
$ |
12,363 |
|
Amortization expense related to intangible assets was $1,521 for the year ended December 31, 2013.
Amortization related to the Company’s finite life intangible assets is scheduled to be expensed over the next five years and thereafter as follows:
2014 |
|
$ |
1,422 |
|
2015 |
|
|
1,291 |
|
2016 |
|
|
1,236 |
|
2017 |
|
|
1,135 |
|
2018 |
|
|
1,001 |
|
Thereafter |
|
|
6,504 |
|
Total |
|
$ |
12,589 |
|
9. DEBT
Credit Facility
On June 24, 2013, the subsidiaries of SLP entered into a $15,000 credit facility with City National Bank. The subsidiaries of SLP are the borrowers under such facility and SLP guarantees the obligations of its subsidiaries under the credit facility. The credit facility is secured by certain assets of SLP and its subsidiaries. The credit facility consists of a $7,500 delayed draw term loan that matures on June 24, 2020 and a $7,500 revolving credit facility that matures on December 24, 2016. The loan bears interest at either (a) the higher of the prime rate plus a margin of 0.05 percentage points and 2.5% or (b) the LIBOR rate plus 3 percentage points, at the borrowers’ option. On June 28, 2013, the borrowers borrowed $7,000 on the revolving credit loan. As of December 31, 2013, no amount has been drawn on the term loan credit facility and the borrowers may draw up to the full amount of the term loan through June 25, 2018. Borrowings under the term loan on or prior to June 24, 2015 will be payable in 20 equal quarterly installments. Borrowings under the term loan after June 24, 2015 will be payable in equal quarterly installments through the maturity date. The credit facility contains restrictions on, among other things, (i) incurrence of additional debt, (ii) creating liens on certain assets, (iii) making certain investments, (iv) consolidating, merging or otherwise disposing of substantially all of our assets, (v) the sale of certain assets, and (vi) entering into transactions with affiliates. In addition, the credit facility contains certain financial covenants including a test on discretionary assets under management, maximum debt to EBITDA and a fixed charge coverage ratio. The credit facility contains
F-20
customary events of default, including the occurrence of a change in control which includes a person or group of persons acting together acquiring more than 30% of the total voting securities of Silvercrest.
As of December 31, 2013, $3,000 of principal remains outstanding under the revolving credit loan.
The interest rate on the revolving credit loan as of December 31, 2013 was 3.3%. Interest expense, which also includes amortization of deferred financing fees, incurred on the revolving credit and term loans was $152 for the year ended December 31, 2013.
Notes Payable
The following is a summary of notes payable:
|
|
December 31, 2013 |
|
|||||
|
|
Interest Rate |
|
|
Amount |
|
||
Principal on fixed rate notes |
|
|
5.0 |
% |
|
$ |
2,665 |
|
Variable rate notes issued for redemption of partners’ interests (see Note 15) |
|
|
Prime plus 1 |
% |
|
|
5,486 |
|
Interest payable |
|
|
|
|
|
|
152 |
|
Total, December 31, 2013 |
|
|
|
|
|
$ |
8,303 |
|
|
|
December 31, 2012 |
|
|||||
|
|
Interest Rate |
|
|
Amount |
|
||
Principal on fixed rate notes |
|
|
5.0 |
% |
|
$ |
2,397 |
|
Variable rate notes issued for redemption of partners’ interest (see Note 15) |
|
|
Prime plus 1 |
% |
|
|
872 |
|
Interest payable |
|
|
|
|
|
|
46 |
|
Total, December 31, 2012 |
|
|
|
|
|
$ |
3,315 |
|
The carrying value of notes payable approximates fair value. The fixed rate notes, which are related to the Ten-Sixty and Milbank acquisitions, approximate fair value based on interest rates currently available to the Company for similar debt. The variable rate notes are based on a multiple of the U.S. Prime Rate.
As of December 31, 2013, future principal amounts payable under the fixed and variable rate notes are as follows:
2014 |
|
$ |
2,619 |
|
2015 |
|
|
2,314 |
|
2016 |
|
|
1,751 |
|
2017 |
|
|
1,467 |
|
Total |
|
$ |
8,151 |
|
10. COMMITMENTS AND CONTINGENCIES
Lease Commitments
The Company leases office space pursuant to operating leases that are subject to specific escalation clauses. Rent expense charged to operations for the years ended December 31, 2013, 2012 and 2011 amounted to $3,558, $3,588, and $3,304, respectively. The Company received sub-lease income from subtenants during the years ended December 31, 2013, 2012 and 2011 of $805, $764, and $1,006, respectively. Therefore, for the years ended December 31, 2013, 2012 and 2011, net rent expense amounted to $2,753, $2,824, and $2,298, respectively, and is included in general and administrative expenses in the Consolidated Statement of Operations.
During 2006, the Company entered into a lease agreement for office space for its headquarters. The lease commenced on January 1, 2007 and expires September 30, 2017. The lease is subject to escalation clauses and provides for rent free periods of 6 to 9 months and a leasehold improvement allowance of $1,538 provided the Company spends at least an additional $513 on improvements. The Company spent $3,284 on leasehold improvements and received $1,499 of the allowance during 2007; the remaining $39 of the allowance was received in 2008. As security for performance under the leases, the Company is required to maintain letters of credit in favor of the landlord totaling $2,023 that were reduced to $1,013 on August 31, 2010 and can be further reduced to $506 on August 31, 2014. The letter of credit is collateralized by a certificate of deposit in an equal amount.
F-21
Future minimum lease payments and rentals under lease agreements which expire through 2017 are as follows:
|
|
Minimum Lease |
|
|
Non-cancellable |
|
|
Minimum Net |
|
|||
2014 |
|
$ |
3,675 |
|
|
$ |
(394 |
) |
|
$ |
3,281 |
|
2015 |
|
|
3,632 |
|
|
|
(408 |
) |
|
|
3,224 |
|
2016 |
|
|
3,590 |
|
|
|
(408 |
) |
|
|
3,182 |
|
2017 |
|
|
2,780 |
|
|
|
(313 |
) |
|
|
2,467 |
|
Total |
|
$ |
13,677 |
|
|
$ |
(1,523 |
) |
|
$ |
12,154 |
|
The Company has capital leases for certain office equipment. The principal balance of these leases was $19 and $33 as of December 31, 2013 and December 31, 2012, respectively.
Contingent Consideration
In connection with its acquisition of MCG in October 2008, SLP entered into a contingent consideration agreement whereby the former members of MCG were entitled to contingent consideration equal to 22% of adjusted annual EBITDA in addition to any performance fee payments for each of the five years subsequent to the date of acquisition. As the acquisition was completed prior to January 1, 2009, contingent consideration is recognized when the contingency is resolved pursuant to the authoritative guidance on business combinations in effect at the date of the closing of the acquisition. The contingent consideration related to the MCG acquisition is recorded on the date when the contingency is resolved. Contingent consideration payments of $703, $720 and $663 were made during the years ended December 31, 2013, 2012 and 2011, respectively, related to MCG and are reflected in investing activities in the Consolidated Statements of Cash Flows.
Quarterly contingent payments related to the Commodity Advisors acquisition were accrued when the contingency was resolved. The total accrual for these payments for the year ended December 31, 2013 was $31, which was recorded as compensation expense in the Consolidated Statements of Operations.
11. STOCKHOLDERS’ EQUITY
Prior to the reorganization described in Note 1, Silvercrest was a private company. SLP historically made, and will continue to make, distributions of its net income to the holders of its partnership units for income tax purposes as required under the terms of its Second Amended and Restated Limited Partnership Agreement and also made, and will continue to make, additional distributions of net income under the terms of its Second Amended and Restated Limited Partnership Agreement. Prior to the reorganization, distributions were treated as equity transactions and recorded in the financial statements on the payment date. Partnership distributions totaled $29,317, $14,749 and $9,994 for the years ended December 31, 2013, 2012 and 2011, respectively. Distributions paid or accrued prior to June 30, 2013 are included in partners’ capital and excess of liabilities, redeemable partners’ capital and partners’ capital over assets, respectively, in the Consolidated Statements of Financial Condition. Distributions accrued and paid subsequent to June 30, 2013 are included in non-controlling interests in the Consolidated Statements of Financial Condition as of December 31, 2013.
SLP distributed $10,000 to its existing partners prior to the consummation of the IPO.
Prior to the reorganization and pursuant to SLP’s Second Amended and Restated Limited Partnership Agreement, as amended and restated, partner incentive allocations were treated as distributions of net income. The remaining net income or loss after partner incentive allocations was generally allocated to the partners based on their pro rata ownership. Net income allocation is subject to the recovery of the allocated losses of prior periods. Distributions of partner incentive allocations of net income for the years ended December 31, 2013, 2012 and 2011 amounted to $12,104, $8,775 and $5,073, respectively, and are included in non-controlling interests as of December 31, 2013 and in excess of liabilities, redeemable partners’ capital and partners’ capital over assets as of December 31, 2012 in the Consolidated Statements of Financial Condition. As part of the reorganization, partner incentive distributions for the six months ended June 30, 2013 were treated as an equity transaction and accrued and recorded in accrued compensation in the Consolidated Statements of Financial Condition as of December 31, 2013. Subsequent to the consummation of the IPO, Silvercrest treats SLP’s partner incentive allocations as compensation expense and accrues such amounts when earned. During the year ended December 31, 2013, SLP accrued partner incentive allocations of $14,196.
The pre-IPO partners of SLP received Silvercrest shares in connection with the reorganization and IPO, as described below.
Silvercrest—Stockholders’ Equity
As described in Note 1, Silvercrest’s equity structure was modified in connection with the IPO-related reorganization.
F-22
Silvercrest has the following authorized and outstanding equity:
|
|
Shares at December 31, 2013 |
||||||||||
|
|
Authorized |
|
|
Outstanding |
|
|
Voting Rights |
|
Economic |
||
Common shares |
|
|
|
|
|
|
|
|
|
|
|
|
Class A, par value $0.01 per share |
|
|
50,000,000 |
|
|
|
7,522,974 |
|
|
1 vote per |
|
All (1) |
Class B, par value $0.01 per share |
|
|
25,000,000 |
|
|
|
4,464,617 |
|
|
1 vote per |
|
None (2), (3) |
Preferred shares |
|
|
|
|
|
|
|
|
|
|
|
|
Preferred stock, par value $0.01 per share |
|
|
10,000,000 |
|
|
|
— |
|
|
See footnote (4) |
|
See footnote (4) |
(1) | Each share of Class A common stock is entitled to one vote per share. Class A common stockholders have 100% of the rights of all classes of Silvercrest’s capital stock to receive dividends. |
(2) | Each share of Class B common stock is entitled to one vote per share. |
(3) | Each Class B unit of SLP held by a principal is exchangeable for one share of the Company’s Class A common stock. The principals collectively hold 4,464,617 Class B units, which represents the right to receive their proportionate share of the distributions made by SLP and 175,298 deferred equity units exercisable for Class B units of SLP, which represents the right to receive additional proportions of the distributions made by SLP. The 175,298 deferred equity units which have been issued to our principals entitle the holders thereof to participate in distributions from SLP as if the underlying Class B units are outstanding and thus are taken into account to determine the economic interest of each holder of units in SLP. However, because the Class B units underlying the deferred equity units have not been issued and are not deemed outstanding, the holders of deferred equity units have no voting rights with respect to those Class B units. Silvercrest will not issue shares of Class B common stock in respect of deferred equity units of SLP until such time that the underlying Class B units are issued. |
(4) | Silvercrest’s board of directors has the authority to issue preferred stock in one or more classes or series and to fix the rights, preferences, privileges and related restrictions, including dividend rights, dividend rates, conversion rights, voting rights, terms of redemption, redemption prices, liquidation preferences and the number of shares constituting any class or series, or the designation of the class or series, without the approval of its stockholders. |
Silvercrest is dependent on cash generated by SLP to fund any dividends. Generally, SLP will distribute its profits to all of its partners, including Silvercrest, based on the proportionate ownership each holds in SLP. Silvercrest will fund dividends to its stockholders from its proportionate share of those distributions after provision for its income taxes and other obligations.
In connection with the reorganization and IPO described in Note 1, “Reorganization and Initial Public Offering”, Silvercrest issued the following shares on the date of the reorganization:
Class A Common Stock
Silvercrest issued 4,790,684 shares of Class A common stock in the IPO. Each Class B unit of SLP acquired by the Company with proceeds from the IPO immediately converted to a Class A unit. Class A units have the same rights as Class B units. During July 2013, the Company issued 718,603 shares of Class A common stock pursuant to the underwriters’ exercise in full of the over-allotment option that the Company granted to the underwriters in connection with its IPO. During November 2013, 2,013,677 shares of Class B common stock automatically converted to Class A common stock upon the death of the Company’s former Chief Executive Officer.
F-23
Class B Common Stock
|
Transaction |
|
|
|
# of |
|
|
Date |
|
|
|
Shares |
|
Class B common stock outstanding - January 1, 2013 |
|
|
|
|
- |
|
Class B common stock issued upon reorganization |
June 2013 |
|
|
|
6,459,316 |
|
Class B common stock issued subsequent to initial public offering |
July 2013 |
|
|
|
16,540 |
|
Class B common stock repurchased and cancelled |
September 2013 |
|
|
|
(14,092 |
) |
Class B common stock issued upon vesting of deferred equity units |
November 2013 |
|
|
|
16,530 |
|
Conversion of Class B common stock to Class A common stock |
November 2013 |
|
|
|
(2,013,677 |
) |
Class B common shares outstanding - December 31, 2013 |
|
|
|
|
4,464,617 |
|
The total amount of shares of Class B common stock outstanding and held by employee-principals equals the number of Class B units those individuals hold in SLP. Shares of Silvercrest’s Class B common stock are issuable only in connection with the issuance of Class B units of SLP. When a vested or unvested Class B unit is issued by SLP, Silvercrest will issue to the holder one share of its Class B common stock in exchange for the payment of its par value, subject to the holder’s agreement to be bound by the terms of a stockholders’ agreement amongst the Class B stockholders of the Company. Each share of Silvercrest’s Class B common stock will be redeemed for its par value and cancelled by Silvercrest if the holder of the corresponding Class B unit exchanges or forfeits its Class B unit pursuant to the terms of the Second Amended and Restated Limited Partnership Agreement of SLP, the terms of the 2012 Equity Incentive Plan of Silvercrest, or otherwise.
12. NOTES RECEIVABLE FROM PARTNERS
Partner contributions to SLP are made in cash, in the form of five or six year interest-bearing promissory notes and/or in the form of nine year interest-bearing limited recourse promissory notes. Limited recourse promissory notes were issued in January 2008 and August 2009 with interest rates of 3.53% and 2.77%, respectively. The recourse limitation includes a stated percentage of the initial principal amount of the limited recourse note plus a stated percentage of the accreted principal amount as of the date upon which all amounts due are paid in full plus all costs and expenses required to be paid by the borrower and all amounts required to be paid pursuant to a pledge agreement associated with each note issued. Certain notes receivable are payable in annual installments and are collateralized by SLP’s units that are purchased with the note. Notes receivable from partners are reflected as a reduction of non-controlling interests in the Consolidated Statements of Financial Condition subsequent to the reorganization and IPO.
Notes receivable from partners are as follows:
|
|
December 31, |
|
|
December 31, |
|
||
Beginning balance |
|
$ |
3,410 |
|
|
$ |
6,024 |
|
Repayment of notes |
|
|
(887 |
) |
|
|
(2,864 |
) |
Interest accrued and capitalized on notes receivable |
|
|
74 |
|
|
|
138 |
|
New notes receivable issued to partners |
|
|
455 |
|
|
|
112 |
|
Ending balance |
|
$ |
3,052 |
|
|
$ |
3,410 |
|
Full recourse and limited recourse notes receivable from partners as of December 31, 2013 and December 31, 2012 are $1,671 and $1,953 and $1,381 and $1,457, respectively. There is no allowance for credit losses on notes receivable from partners as of December 31, 2013 and December 31, 2012.
13. RELATED PARTY TRANSACTIONS
During 2013 and 2012, the Company provided services to the domesticated Silvercrest Hedged Equity Fund LP (formed in 2011 and formerly Silvercrest Hedged Equity Fund), Silvercrest Hedged Equity Fund (International), Silvercrest Hedged Equity Fund Ltd (formed in 2011 and includes ERISA investors of Silvercrest Hedged Equity Fund LP), the domesticated Silvercrest Emerging Markets Fund LP (formed in 2011 and formerly Silvercrest Emerging Markets Fund), Silvercrest Emerging Markets Fund (International), Silvercrest Emerging Markets Fund Ltd (formed in 2011 and includes ERISA investors of Silvercrest Emerging Markets Fund LP), Silvercrest Market Neutral Fund (currently in liquidation), Silvercrest Market Neutral Fund (International) (currently in liquidation), Silvercrest Municipal Advantage Portfolio A LLC, Silvercrest Municipal Advantage Portfolio P LLC, the domesticated Silvercrest Strategic Opportunities Fund LP (formed in 2011 and formerly Silvercrest Strategic Opportunities Fund), and Silvercrest Strategic Opportunities Fund (International) (terminated in 2011). These entities operate as feeder funds investing through master-feeder structures except for Silvercrest Hedged Equity Fund LP, Silvercrest Hedged Equity Fund Ltd, Silvercrest Emerging Markets Fund LP, Silvercrest Emerging Markets Fund Ltd, and Silvercrest Strategic Opportunities Fund LP which operate and invest as stand-alone funds.
The Company also provides services to the Silvercrest Global Opportunities Fund, L.P. (currently in liquidation), Silvercrest Global Opportunities Fund (International), Ltd. (currently in liquidation), Silvercrest Capital Appreciation Fund LLC (currently in liquidation), Silvercrest International Equity Fund, L.P. (merged into Silvercrest International Fund, L.P. in October 2013), Silvercrest
F-24
Municipal Special Situations Fund LLC, Silvercrest Municipal Special Situations Fund II LLC, Silvercrest Select Growth Equity Fund, L.P., Silvercrest International Fund, L.P. (previously known as Silvercrest Global Partners, L.P.), Silvercrest Small Cap, L.P. Silvercrest Special Situations, L.P., and Silvercrest Commodity Strategies Fund, LP which operate and invest separately as stand- alone funds.
Pursuant to agreements with the above entities, the Company provides investment advisory services and receives an annual management fee of 0% to 1.75% of assets under management and a performance fee or allocation of 0% to 10% of the above entities’ net appreciation over a high-water mark.
For the years ended December 31, 2013, 2012 and 2011 the Company earned from the above activities management fee income, which is included in “Management and advisory fees” in the Consolidated Statement of Operations, of $8,994, $8,484, and $5,403, respectively, and performance fees and allocations of $14, $2,615, and $1,046, respectively, of which $14, $1,901 and $950, respectively, is included in equity income from investments and $0, $714 and $85, respectively, is included in performance fees in the Consolidated Statements of Operations. As of December 31, 2013 and December 31, 2012, the Company was owed $2,653 and $1,622, respectively, from its various funds, which is included in the Due from Silvercrest Funds on the Consolidated Statements of Financial Condition.
For the years ended December 31, 2013, 2012 and 2011, the Company earned advisory fees of $479, $408 and $427, respectively, from assets managed on behalf of certain of its partners. As of December 31, 2013 and December 31, 2012, the Company is owed approximately $78 and $17, respectively, from certain of its partners, which is included in receivables, net on the Consolidated Statements of Financial Condition.
For the year ended December 31, 2013, the Company expensed approximately $780 for payments to be made through November 2014 to a relative of the Company’s former Chief Executive Officer which are included in general and administrative expenses in the Consolidated Statement of Operations.
At December 31, 2013, the Company had a receivable for life insurance proceeds of $3,010, as it was the beneficiary on a key-man policy in the name of our former Chief Executive Officer, which was included in prepaid and other assets on the Consolidated Statement of Financial Condition. The Company received these proceeds in January 2014.
14. INCOME TAXES
|
|
Year Ended December 31, |
|
|||||||||
|
|
2013 |
|
|
2012 |
|
|
2011 |
|
|||
Current Provision: |
|
|
|
|
|
|
|
|
|
|
|
|
Federal |
|
$ |
435 |
|
|
$ |
6 |
|
|
$ |
6 |
|
State and local |
|
|
1,430 |
|
|
|
1,029 |
|
|
|
835 |
|
Total Current Provision |
|
|
1,865 |
|
|
|
1,035 |
|
|
|
841 |
|
Deferred (Benefit) Provision: |
|
|
|
|
|
|
|
|
|
|
|
|
Federal |
|
|
176 |
|
|
|
(14 |
) |
|
|
(281 |
) |
State and local |
|
|
107 |
|
|
|
36 |
|
|
|
6 |
|
Total Deferred Provision (Benefit) |
|
|
283 |
|
|
|
22 |
|
|
|
(275 |
) |
Total Provision for Income Taxes |
|
$ |
2,148 |
|
|
$ |
1,057 |
|
|
$ |
566 |
|
Deferred taxes reflect the net tax effects of temporary differences between the carrying amounts of assets and liabilities for financial reporting purposes and their bases for income tax purposes.
As of December 31, 2013 and 2012, the Company had a net deferred tax asset (liability) of $25,683 and ($130), respectively. As of December 31, 2013, the net deferred tax asset of $25,683, which is recorded as a net non-current deferred tax asset of $25,831 specific to Silvercrest, consists primarily of assets related to temporary differences between the financial statement and tax bases of intangibles related to its acquisition of partnership units of SLP, a net non-current deferred tax liability of $34 specific to SLP which consists primarily of liabilities related to differences between the financial statement and tax bases of intangible assets, and a non-current deferred tax liability of $114 related to the corporate activity of SFS which is primarily related to temporary differences between the financial statement and tax bases of intangible assets.
F-25
A summary of deferred tax assets and liabilities as follows:
|
|
As of December 31, |
|
|||||||
|
|
2013 |
|
|
2012 |
|
||||
Deferred tax assets |
|
|
|
|
|
|
|
|
||
Intangible assets |
|
$ |
25,050 |
|
|
$ |
- |
|
||
Deferred rent |
|
|
482 |
|
|
|
112 |
|
||
Equity-based compensation of partners |
|
|
222 |
|
|
|
32 |
|
||
Other |
|
|
147 |
|
|
|
2 |
|
||
Total deferred tax assets |
|
$ |
25,901 |
|
|
$ |
146 |
|
||
Deferred tax liabilities |
|
|
|
|
|
|
|
|
||
Intangible assets |
|
$ |
218 |
|
|
$ |
238 |
|
||
Other |
|
|
- |
|
|
|
38 |
|
||
Total deferred tax liabilities |
|
$ |
218 |
|
|
$ |
276 |
|
||
Net deferred tax assets (liabilities) |
|
$ |
25,683 |
|
|
$ |
(130 |
) |
||
The following table reconciles the provision for income taxes to the U.S. Federal statutory tax rate:
|
|
Year Ended December 31, |
|
|||||||||
|
|
2013 |
|
|
2012 |
|
|
2011 |
|
|||
Statutory U.S. federal income tax rate |
|
|
35.00 |
% |
|
|
35.00 |
% |
|
|
35.00 |
% |
Income passed through to Partners |
|
|
(25.57 |
)% |
|
|
(35.00 |
)% |
|
|
(35.00 |
)% |
State and local income taxes |
|
|
6.92 |
% |
|
|
5.26 |
% |
|
|
5.72 |
% |
Life insurance proceeds |
|
|
(5.41) |
% |
|
|
0.00 |
% |
|
|
0.00 |
% |
Other |
|
|
0.13 |
% |
|
|
(0.17) |
% |
|
|
(1.99 |
)% |
Effective income tax rate |
|
|
11.07 |
% |
|
|
5.09 |
% |
|
|
3.73 |
% |
As of December 31, 2013 and 2012, the Company had taxes payable of $1,153 and $356, respectively. For December 31, 2013 and December 31, 2012, taxes payable consisted of federal and state and local taxes payable of $430 and $723, and $0 and $356, respectively.
Of the total net deferred taxes at December 31, 2013, $55 of the net deferred tax liabilities relate to non-controlling interests. These amounts are included in deferred tax and other liabilities on the Consolidated Statement of Financial Position, respectively.
As of December 31, 2012, the Company had $130 of net deferred tax liabilities, and these amounts are included in the prepaid expenses and other assets and deferred tax and other liabilities in the Consolidated Statement of Financial Condition.
In the normal course of business, the Company is subject to examination by federal, state, and local tax regulators. As of December 31, 2013, the Company’s U.S. federal income tax returns for the years 2010 through 2012 are open under the normal three-year statute of limitations and therefore subject to examination.
The guidance for accounting for uncertainty in income taxes prescribes a recognition threshold and a measurement attribute for the financial statement recognition and measurement of tax positions taken or expected to be taken in a tax return. For those benefits to be recognized, a tax position must be more likely than not to be sustained upon examination by taxing authorities. The amount recognized is measured as the largest amount of benefit that is greater than 50% likely of being realized upon ultimate settlement. The Company does not believe that it has any tax positions for which it is reasonably possible that the total amounts of unrecognized tax benefits will significantly increase or decrease within the next twelve months. Furthermore, the Company does not have any material uncertain tax positions at December 31, 2013 and 2012.
F-26
15. REDEEMABLE PARTNERSHIP UNITS
Before the reorganization and consummation of our IPO, upon the termination of employment, SLP had a right to call the terminated employee’s partnership units. In addition, the terminated employee also had a right to put the partnership units back to SLP upon termination or death, provided the terminated employee had complied with certain restrictions as described in SLP’s partnership agreement. With respect to the two founders of SLP, their estate, heirs or other permitted related parties could not require SLP to redeem their units prior to April 1, 2013. In accordance with the provisions of SLP’s Second Amended and Restated Limited Partnership Agreement, the put described above expired upon the consummation of the Company’s reorganization. The redemption value per share was based on a multiple of historical EBITDA, pursuant to SLP’s partnership agreement. Once units were called or put back to SLP, the redemption resulted in the issuance of a promissory note by SLP which was typically paid in installments over four years. SLP had redeemable partners’ capital of $102,017 as of December 31, 2012, which represented the amount of partners’ capital subject to both put and call rights.
Subsequent to the completion of the Company’s initial public offering, if a principal of SLP is terminated for cause, SLP would have the right to redeem all of the vested Class B units collectively held by the principal and his or her permitted transferees for a purchase price equal to the lesser of (i) the aggregate capital account balance in SLP of the principal and his or her permitted transferees and (ii) the purchase price paid by the terminated principal to first acquire the Class B units.
16. EQUITY-BASED COMPENSATION
Determining the appropriate fair value model and calculating the fair value of equity compensation awards requires the input of complex and subjective assumptions, including the expected life of the equity compensation awards and the stock price volatility. In addition, determining the appropriate amount of associated periodic expense requires management to estimate the amount of employee forfeitures and the likelihood of the achievement of certain performance targets. The assumptions used in calculating the fair value of equity compensation awards and the associated periodic expense represent management’s best estimates, but these estimates involve inherent uncertainties and the application of judgment. As a result, if factors change and the Company deems it necessary in the future to modify the assumptions it made or to use different assumptions, or if the quantity and nature of the Company’s equity-based compensation awards changes, then the amount of expense may need to be adjusted and future equity compensation expense could be materially different from what has been recorded in the current period.
SLP has granted equity-based compensation awards to certain partners under SLP’s 2010, 2011 and 2012 Deferred Equity programs (the “Equity Programs”). The Equity Programs allow for the granting of deferred equity units based on the fair value of the Company’s units. These deferred equity units contain both service and performance requirements.
Each grant includes a deferred equity unit (“Deferred Equity Unit”) and performance unit (“Performance Unit”) subject to various terms including terms of forfeiture and acceleration of vesting. The Deferred Equity Unit represents the unsecured right to receive one unit of SLP or the equivalent cash value of up to 50% (or such other percentage as may be determined by the Company’s Executive Committee) of SLP’s units issuable upon the vesting of any such Deferred Equity Units and the remaining 50% in units upon the vesting of any such Deferred Equity Units. Such cash amount is to be calculated using the equivalent share price of the Silvercrest’s Class A Common Stock as of the applicable vesting date. The Performance Unit represents the unsecured right to receive one unit of SLP for every two units of SLP issuable upon the vesting of any such Deferred Equity Units.
Twenty-five percent of the Deferred Equity Units vest on each of the first, second, third, and fourth anniversaries of the grant date until the Deferred Equity Units are fully vested. The Performance Units are subject to forfeiture and subject to the satisfaction of a predetermined performance target at the end of the four-year vesting period. If the performance target is achieved, then the Performance Units vest at the end of the four-year vesting period. The rights of the partners with respect to the Performance Units remain subject to forfeiture at all times prior to the date on which such rights become vested and will be forfeited if the performance target is not achieved.
Distributions related to Deferred Equity Units that are paid to partners are charged to non-controlling interests after the consummation of our IPO and excess of liabilities, redeemable partners’ capital and partners’ capital over assets prior to our IPO. Distributions related to the unvested portion of Deferred Equity Units that are assumed to be forfeited are recognized as compensation expense because these distributions are not required to be returned by partners to SLP upon forfeiture.
The Company utilized both discounted cash flow and guideline company valuation methods to determine the grant date fair value of the Deferred Equity Units. The grant date fair values of Performance Units were determined by applying a performance probability factor to the Deferred Equity Unit Value. These methodologies included the use of third party data and discounts for lack of control and marketability.
Prior to our IPO, all Deferred Equity Units were considered to be liability awards and were adjusted to fair value at the end of each reporting period. After the consummation of our IPO, only the portion of Deferred Equity Units that can be settled in cash are considered to be liability awards and are adjusted to fair value at the end of each reporting period.
F-27
For the years ended December 31, 2013, 2012 and 2011, the Company recorded compensation expense related to such units of $2,222, $1,388 and $1,060, respectively, of which $245, $147 and $128, respectively, relates to the Performance Units given that there is an explicit service period associated with the Deferred Equity Units, and the likelihood that the performance target will be met is considered probable. Distributions include cash distributions paid on liability awards. Cash distributions paid on awards expected to be forfeited were $13, $17, and $20 for the years ended December 31, 2013, 2012 and 2011, respectively, and are part of total compensation expense for the years then ended. During the years ended December 31, 2013, 2012 and 2011, $260, $63 and $83, respectively, of vested Deferred Equity Units were settled in cash. As of December 31, 2013 and December 31, 2012, there was $906 and $1,428, respectively, of estimated unrecognized compensation expense related to unvested awards. As of December 31, 2013 and December 31, 2012, the unrecognized compensation expense related to unvested awards is expected to be recognized over a period of 1.16 and 2.16 years, respectively. The unit and per unit amounts below have been converted in connection with the reorganization of SLP, whereby, SLP completed a unit distribution of 19.64 units for each unit outstanding (excluding deferred equity units) as of the date of the consummation of the IPO.
A summary of these equity grants by the Company as of December 31, 2013, 2012 and 2011 during the periods then ended is presented below:
|
|
|
Deferred Equity Units |
|
|
Performance Units |
|
|||||||||||
|
|
Units |
|
|
Fair Value |
|
|
Units |
|
|
Fair Value |
|
||||||
Balance at January 1, 2011 |
|
|
310,469 |
|
|
$ |
|
|
7.55 |
|
|
|
155,235 |
|
|
$ |
4.13 |
|
Granted |
|
|
212,151 |
|
|
|
|
|
8.00 |
|
|
|
106,076 |
|
|
|
3.07 |
|
Vested |
|
|
(83,607 |
) |
|
|
|
|
(8.00 |
) |
|
|
— |
|
|
|
(3.07 |
) |
Forfeited |
|
|
— |
|
|
|
|
|
|
|
|
|
(10,625 |
) |
|
|
|
|
Balance at December 31, 2011 |
|
|
439,193 |
|
|
$ |
|
|
8.00 |
|
|
|
250,686 |
|
|
$ |
3.07 |
|
Granted |
|
|
19,642 |
|
|
|
|
|
12.84 |
|
|
|
9,821 |
|
|
|
4.70 |
|
Vested |
|
|
(128,953 |
) |
|
|
|
|
(12.84 |
) |
|
|
— |
|
|
|
|
|
Forfeited |
|
|
— |
|
|
|
|
|
|
|
|
|
(2,750 |
) |
|
|
(4.70 |
) |
Balance at December 31, 2012 |
|
|
329,757 |
|
|
$ |
|
|
10.47 |
|
|
|
257,757 |
|
|
$ |
3.27 |
|
Granted |
|
|
— |
|
|
|
|
|
|
|
|
|
— |
|
|
|
|
|
Vested |
|
|
(150,398 |
) |
|
|
|
|
(17.05 |
) |
|
|
— |
|
|
|
|
|
Forfeited |
|
|
(4,066 |
) |
|
|
|
|
(17.05 |
) |
|
|
(19,386 |
) |
|
|
(3.75 |
) |
Balance at December 31, 2013 |
|
|
175,298 |
|
|
$ |
12.00 - |
$ |
17.05 |
|
|
|
238,371 |
|
|
$ |
3.75 |
|
The Company estimates 10% of all awards to be forfeited and the related service period is four years.
On November 2, 2012, the Company’s board of directors adopted the 2012 Equity Incentive Plan.
A total of 1,687,500 shares were originally reserved and available for issuance under the 2012 Equity Incentive Plan. As of December 31, 2013, 1,670,960 shares are available for grant. The equity interests may be issued in the form of shares of the Company’s Class A common stock and Class B units of SLP. (All references to units or interests of SLP refer to Class B units of SLP and accompanying shares of Class B common stock of Silvercrest).
The purposes of the 2012 Equity Incentive Plan are to (i) align the long-term financial interests of our employees, directors, consultants and advisers with those of our stockholders; (ii) attract and retain those individuals by providing compensation opportunities that are consistent with our compensation philosophy; and (iii) provide incentives to those individuals who contribute significantly to our long-term performance and growth. To accomplish these purposes, the 2012 Equity Incentive Plan provides for the grant of units of SLP. The 2012 Equity Incentive Plan also provides for the grant of stock options, stock appreciation rights, or SARs, restricted stock awards, restricted stock units, performance-based stock awards and other stock-based awards (collectively, stock awards) based on our Class A common stock. Awards may be granted to employees, including officers, members, limited partners or partners who are engaged in the business of one or more of our subsidiaries, as well as non-employee directors and consultants.
It is initially anticipated that awards under the 2012 Equity Incentive Plan granted to our employees will be in the form of units of SLP that will not vest until a specified period of time has elapsed, or other vesting conditions have been satisfied as determined by the Compensation Committee of the Company’s board of directors, and which may be forfeited if the vesting conditions are not met. During the period that any vesting restrictions apply, unless otherwise determined by the Compensation Committee, the recipient of the award will be eligible to participate in distributions of income from SLP. In addition, before the vesting conditions have been satisfied, the transferability of such units is generally prohibited and such units will not be eligible to be exchanged for cash or shares of our Class A common stock.
F-28
17. DEFINED CONTRIBUTION AND DEFERRED COMPENSATION PLANS
SAMG LLC has a defined contribution 401(k) savings plan (the “Plan”) for all eligible employees who meet the minimum age and service requirements as defined in the Plan. The Plan is designed to be a qualified plan under sections 401(a) and 401(k) of the Internal Revenue Code. For employees who qualify under the terms of the Plan, on an annual basis Silvercrest matches dollar for dollar an employee’s contributions up to the first 4% of compensation. For the years ended December 31, 2013, 2012 and 2011, Silvercrest made matching contributions of $60, $63 and $71, respectively, for the benefit of employees.
18. SOFT DOLLAR ARRANGEMENTS
The Company obtains research and other services through “soft dollar” arrangements. The Company receives credits from broker-dealers whereby technology-based research, market quotation and/or market survey services are effectively paid for in whole or in part by “soft dollar” brokerage arrangements. Section 28(e) of the Securities Exchange Act of 1934, as amended, provides a “safe harbor” to an investment adviser against claims that it breached its fiduciary duty under state or federal law (including ERISA) solely because the adviser caused its clients’ accounts to pay more than the lowest available commission for executing a securities trade in return for brokerage and research services. To rely on the safe harbor offered by Section 28(e), (i) the Company must make a good-faith determination that the amount of commissions is reasonable in relation to the value of the brokerage and research services being received and (ii) the brokerage and research services must provide lawful and appropriate assistance to the Company in carrying out its investment decision-making responsibilities. If the use of soft dollars is limited or prohibited in the future by regulation, the Company may have to bear the costs of such research and other services. For the years ended December 31, 2013, 2012 and 2011, the Company utilized “soft dollar” credits of $992, $320 and $861, respectively.
19. SELECTED QUARTERLY FINANCIAL DATA (UNAUDITED)
The following is a summary of the quarterly results of operations of the Company for the years ended December 31, 2013 and 2012.
|
|
2013 |
|
|||||||||||||
|
|
First Quarter |
|
|
Second Quarter |
|
|
Third Quarter |
|
|
Fourth Quarter |
|
||||
Revenue |
|
$ |
13,685 |
|
|
$ |
14,472 |
|
|
$ |
14,737 |
|
|
$ |
17,157 |
|
Income before other income (expense), net |
|
$ |
5,774 |
|
|
$ |
5,825 |
|
|
$ |
3,187 |
|
|
$ |
1,747 |
|
Net income |
|
$ |
5,464 |
|
|
$ |
5,467 |
|
|
$ |
2,249 |
|
|
$ |
3,989 |
|
Net income attributable to Silvercrest |
|
|
|
|
|
|
|
|
|
$ |
734 |
|
|
$ |
2,026 |
|
Net income per share/unit - basic |
|
$ |
0.53 |
|
|
$ |
0.53 |
|
|
$ |
0.14 |
|
|
$ |
0.32 |
|
Net income per share/unit - diluted |
|
$ |
0.52 |
|
|
$ |
0.52 |
|
|
$ |
0.14 |
|
|
$ |
0.32 |
|
Weighted average shares/units outstanding - basic |
|
|
10,339,456 |
|
|
|
10,316,636 |
|
|
|
5,363,493 |
|
|
|
6,390,588 |
|
Weighted average shares/units outstanding - diluted |
|
|
10,576,545 |
|
|
|
10,553,725 |
|
|
|
5,363,493 |
|
|
|
6,390,588 |
|
|
|
2012 |
|
|||||||||||||
|
|
First Quarter |
|
|
Second Quarter |
|
|
Third Quarter |
|
|
Fourth Quarter |
|
||||
Revenue |
|
$ |
11,880 |
|
|
$ |
12,907 |
|
|
$ |
12,759 |
|
|
$ |
14,144 |
|
Income before other income (expense), net |
|
$ |
4,546 |
|
|
$ |
5,432 |
|
|
$ |
4,938 |
|
|
$ |
3,986 |
|
Net income |
|
$ |
4,289 |
|
|
$ |
5,114 |
|
|
$ |
4,658 |
|
|
$ |
5,659 |
|
Net income per share/unit - basic |
|
$ |
0.41 |
|
|
$ |
0.49 |
|
|
$ |
0.44 |
|
|
$ |
0.54 |
|
Net income per share/unit – diluted |
|
$ |
0.40 |
|
|
$ |
0.48 |
|
|
$ |
0.44 |
|
|
$ |
0.53 |
|
Weighted average shares/units outstanding - basic |
|
|
10,541,946 |
|
|
|
10,488,471 |
|
|
|
10,547,365 |
|
|
|
10,547,365 |
|
Weighted average shares/units outstanding - diluted |
|
|
10,799,746 |
|
|
|
10,634,922 |
|
|
|
10,693,816 |
|
|
|
10,693,816 |
|
*****
F-29